
|
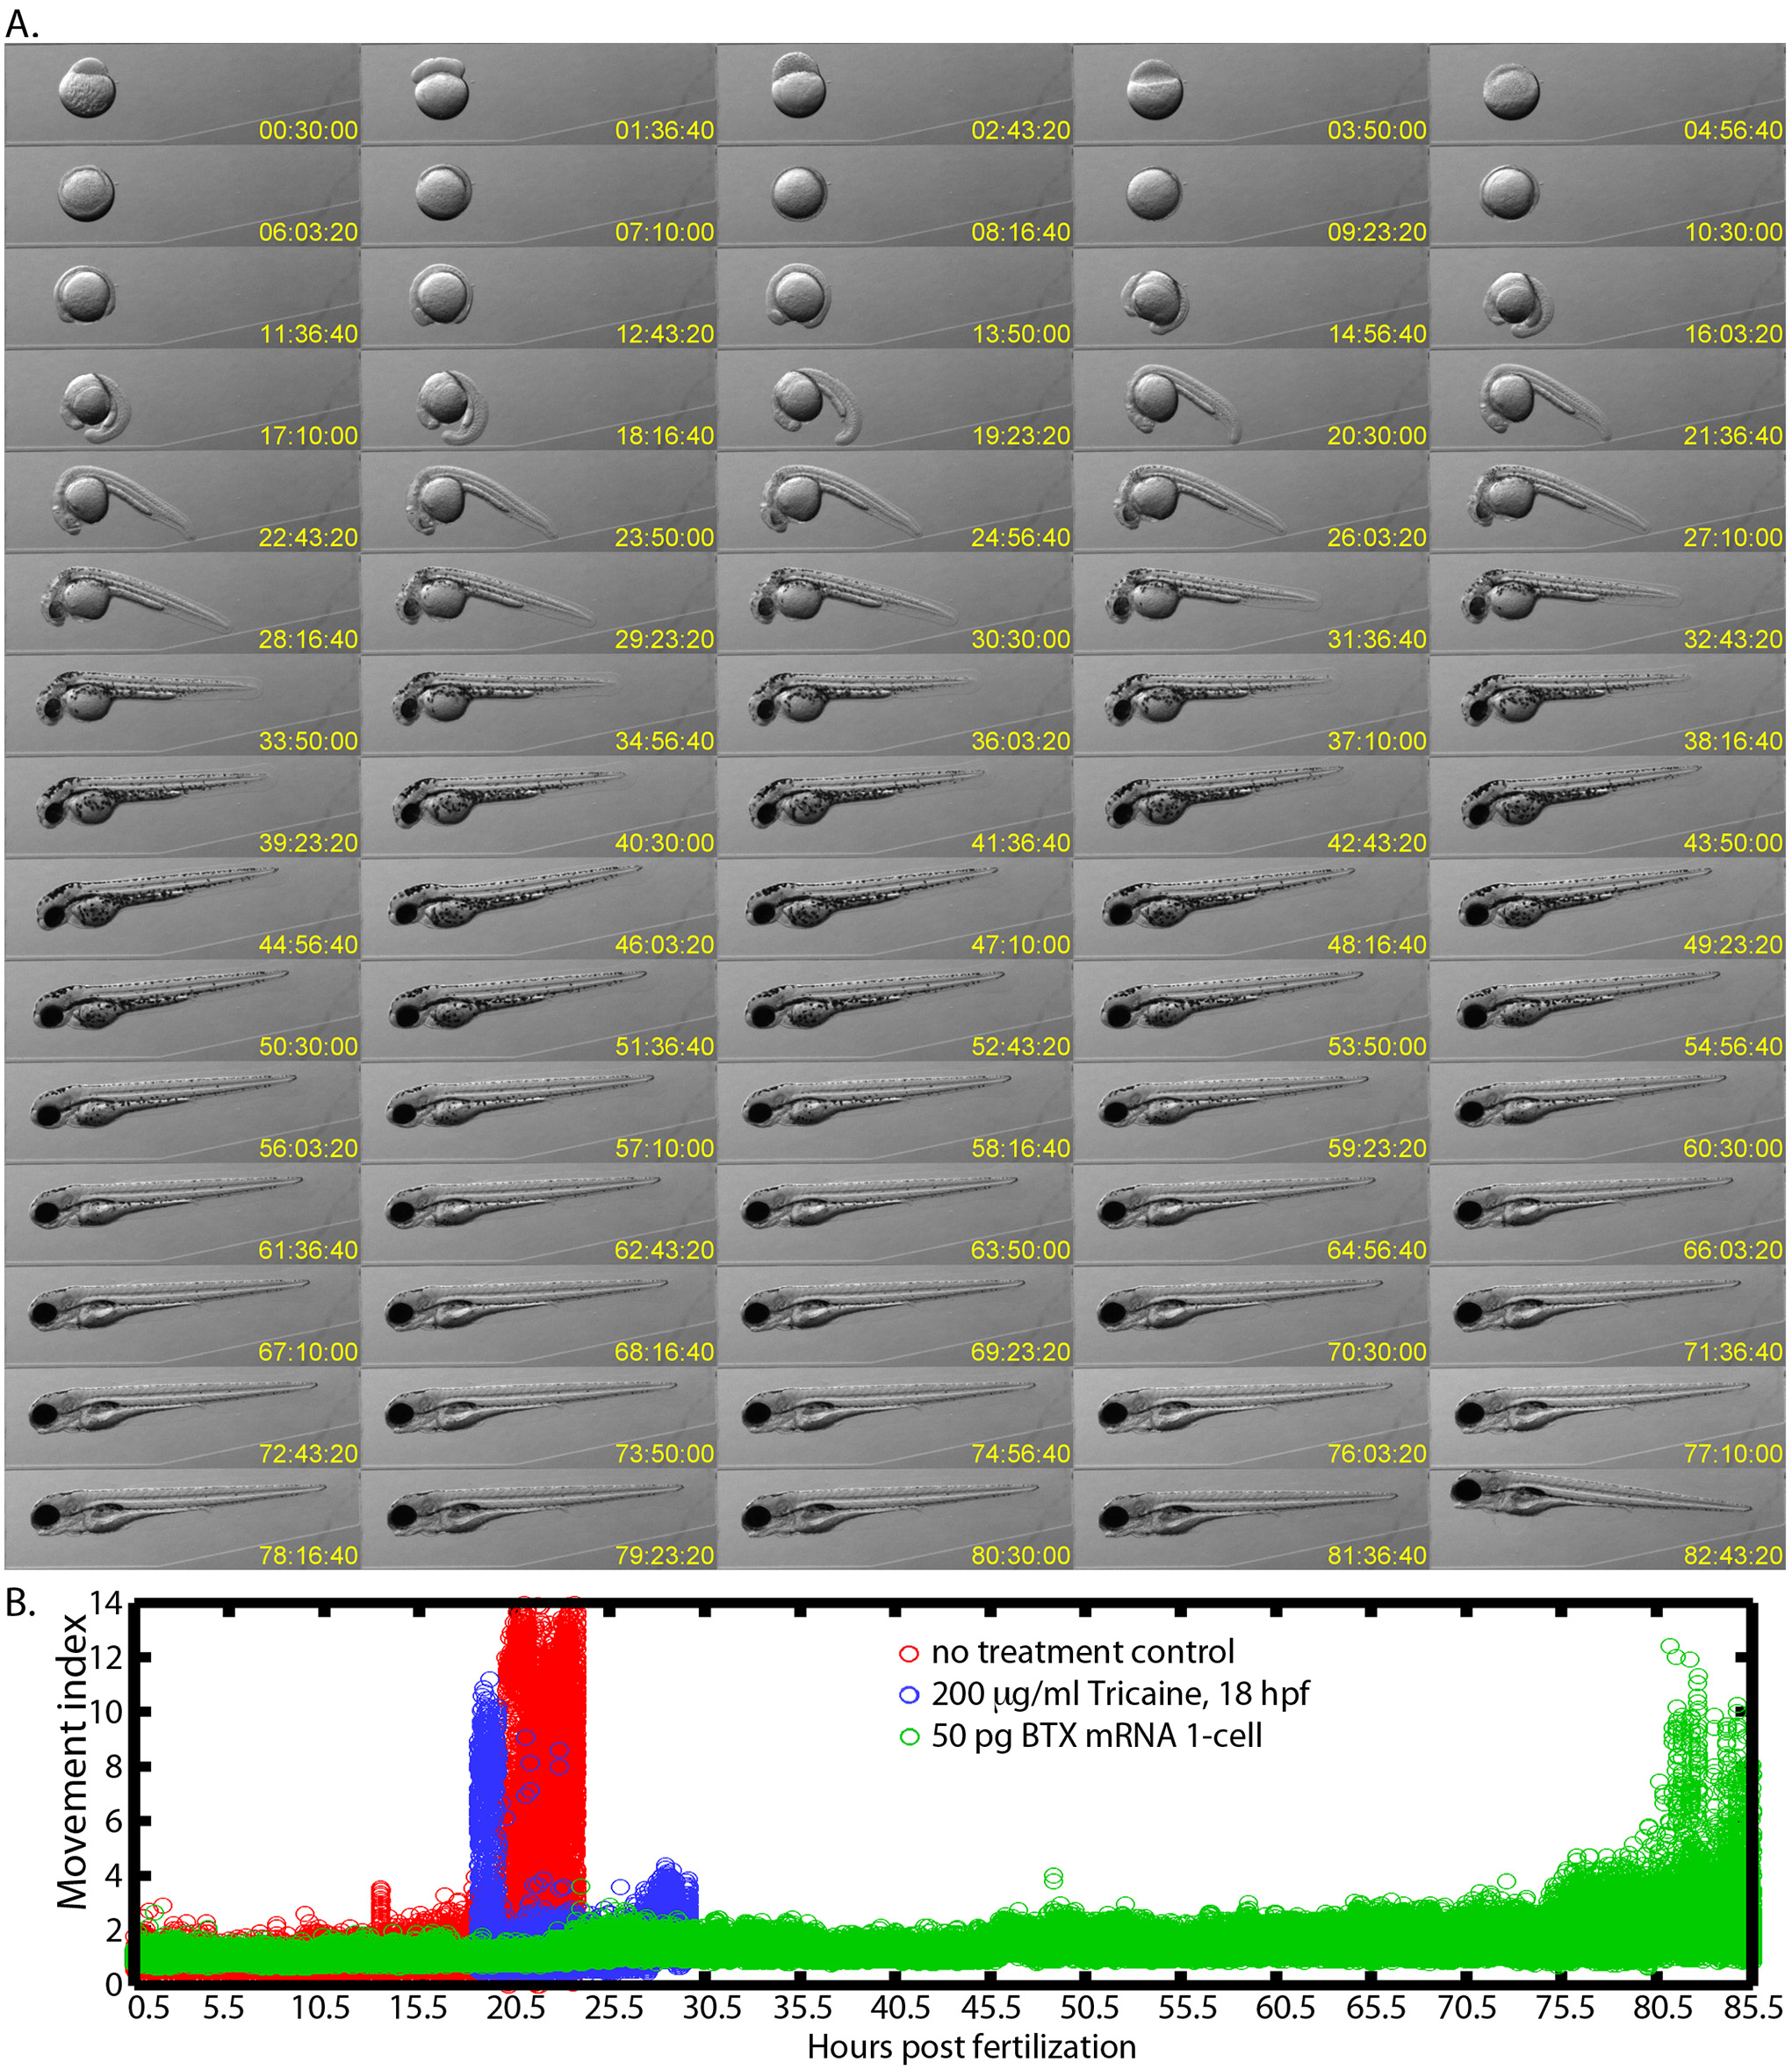
Fig. 4
Long-term imaging of embryos immobilized with α-bungarotoxin mRNA.
(A) Montage of an immobilized embryo’s development from the 1-cell stage to 85 hpf after it had been injected with 50 pg of α-bungarotoxin mRNA into the 1-cell. Images are shown from every hour of development. (B) Quantification of the full time-course that included 153,452 images that were acquired every 2 seconds. The movement index was calculated as the maximum difference between each image and its subsequent image in the time-series. The index was normalized to the average maximum difference in the first 2,000 time points. Control embryos (red) and embryos in 200 µg/ml tricaine (blue) begin twitching at around 18 hpf and then may swim out of the field while α-bungarotoxin injected embryos (green) showed very little movement until 80 hpf.