
IMAGE
Fig. S1
- ID
- ZDB-IMAGE-151009-53
- Publication
- Li-Villarreal et al., 2015 - Dachsous1b cadherin regulates actin and microtubule cytoskeleton during early zebrafish embryogenesis
- All Figures
- Figures for Li-Villarreal et al., 2015
Image
|
Figure Caption
Fig. S1
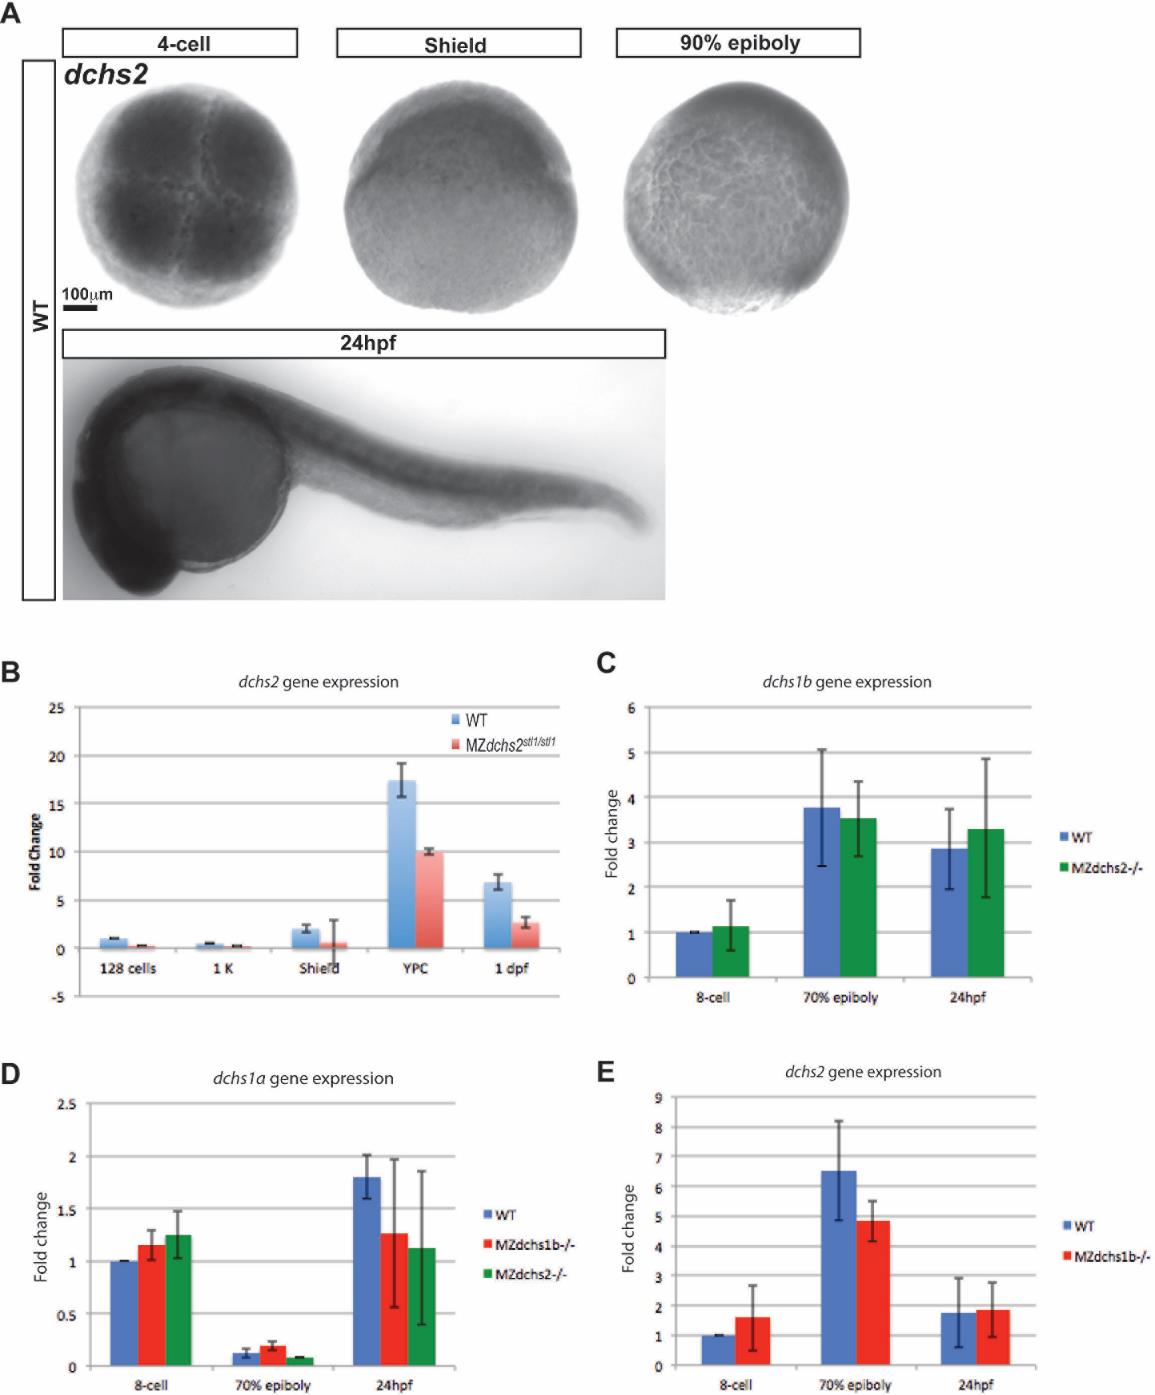
dchs expression in zebrafish
A. Whole-mount in situ hybridization of dchs2 in WT embryos at 4-cell (1 hpf), shield (6 hpf), 90% epiboly (9 hpf), and 24 hpf stages.
B. Quantitative RT-PCR analysis of dchs2 expression levels in MZdchs2stl1/stl1 mutants relative to WT embryos at maternal and zygotic stages.
C. Relative expression by qRT-PCR of dchs1b in WT and MZdchs1bstl1/stl1 embryos.
D. Relative expression by qRT-PCR of dchs1a in WT, MZdchs1bfh275/fh275, and MZdchs1bstl1/stl1 embryos.
E. Relative expression by qRT-PCR of dchs2 in WT and MZdchs1bfh275/fh275 embryos.
Acknowledgments
This image is the copyrighted work of the attributed author or publisher, and
ZFIN has permission only to display this image to its users.
Additional permissions should be obtained from the applicable author or publisher of the image.
Full text @ Development