
Image
|
Figure Caption
Fig. 5
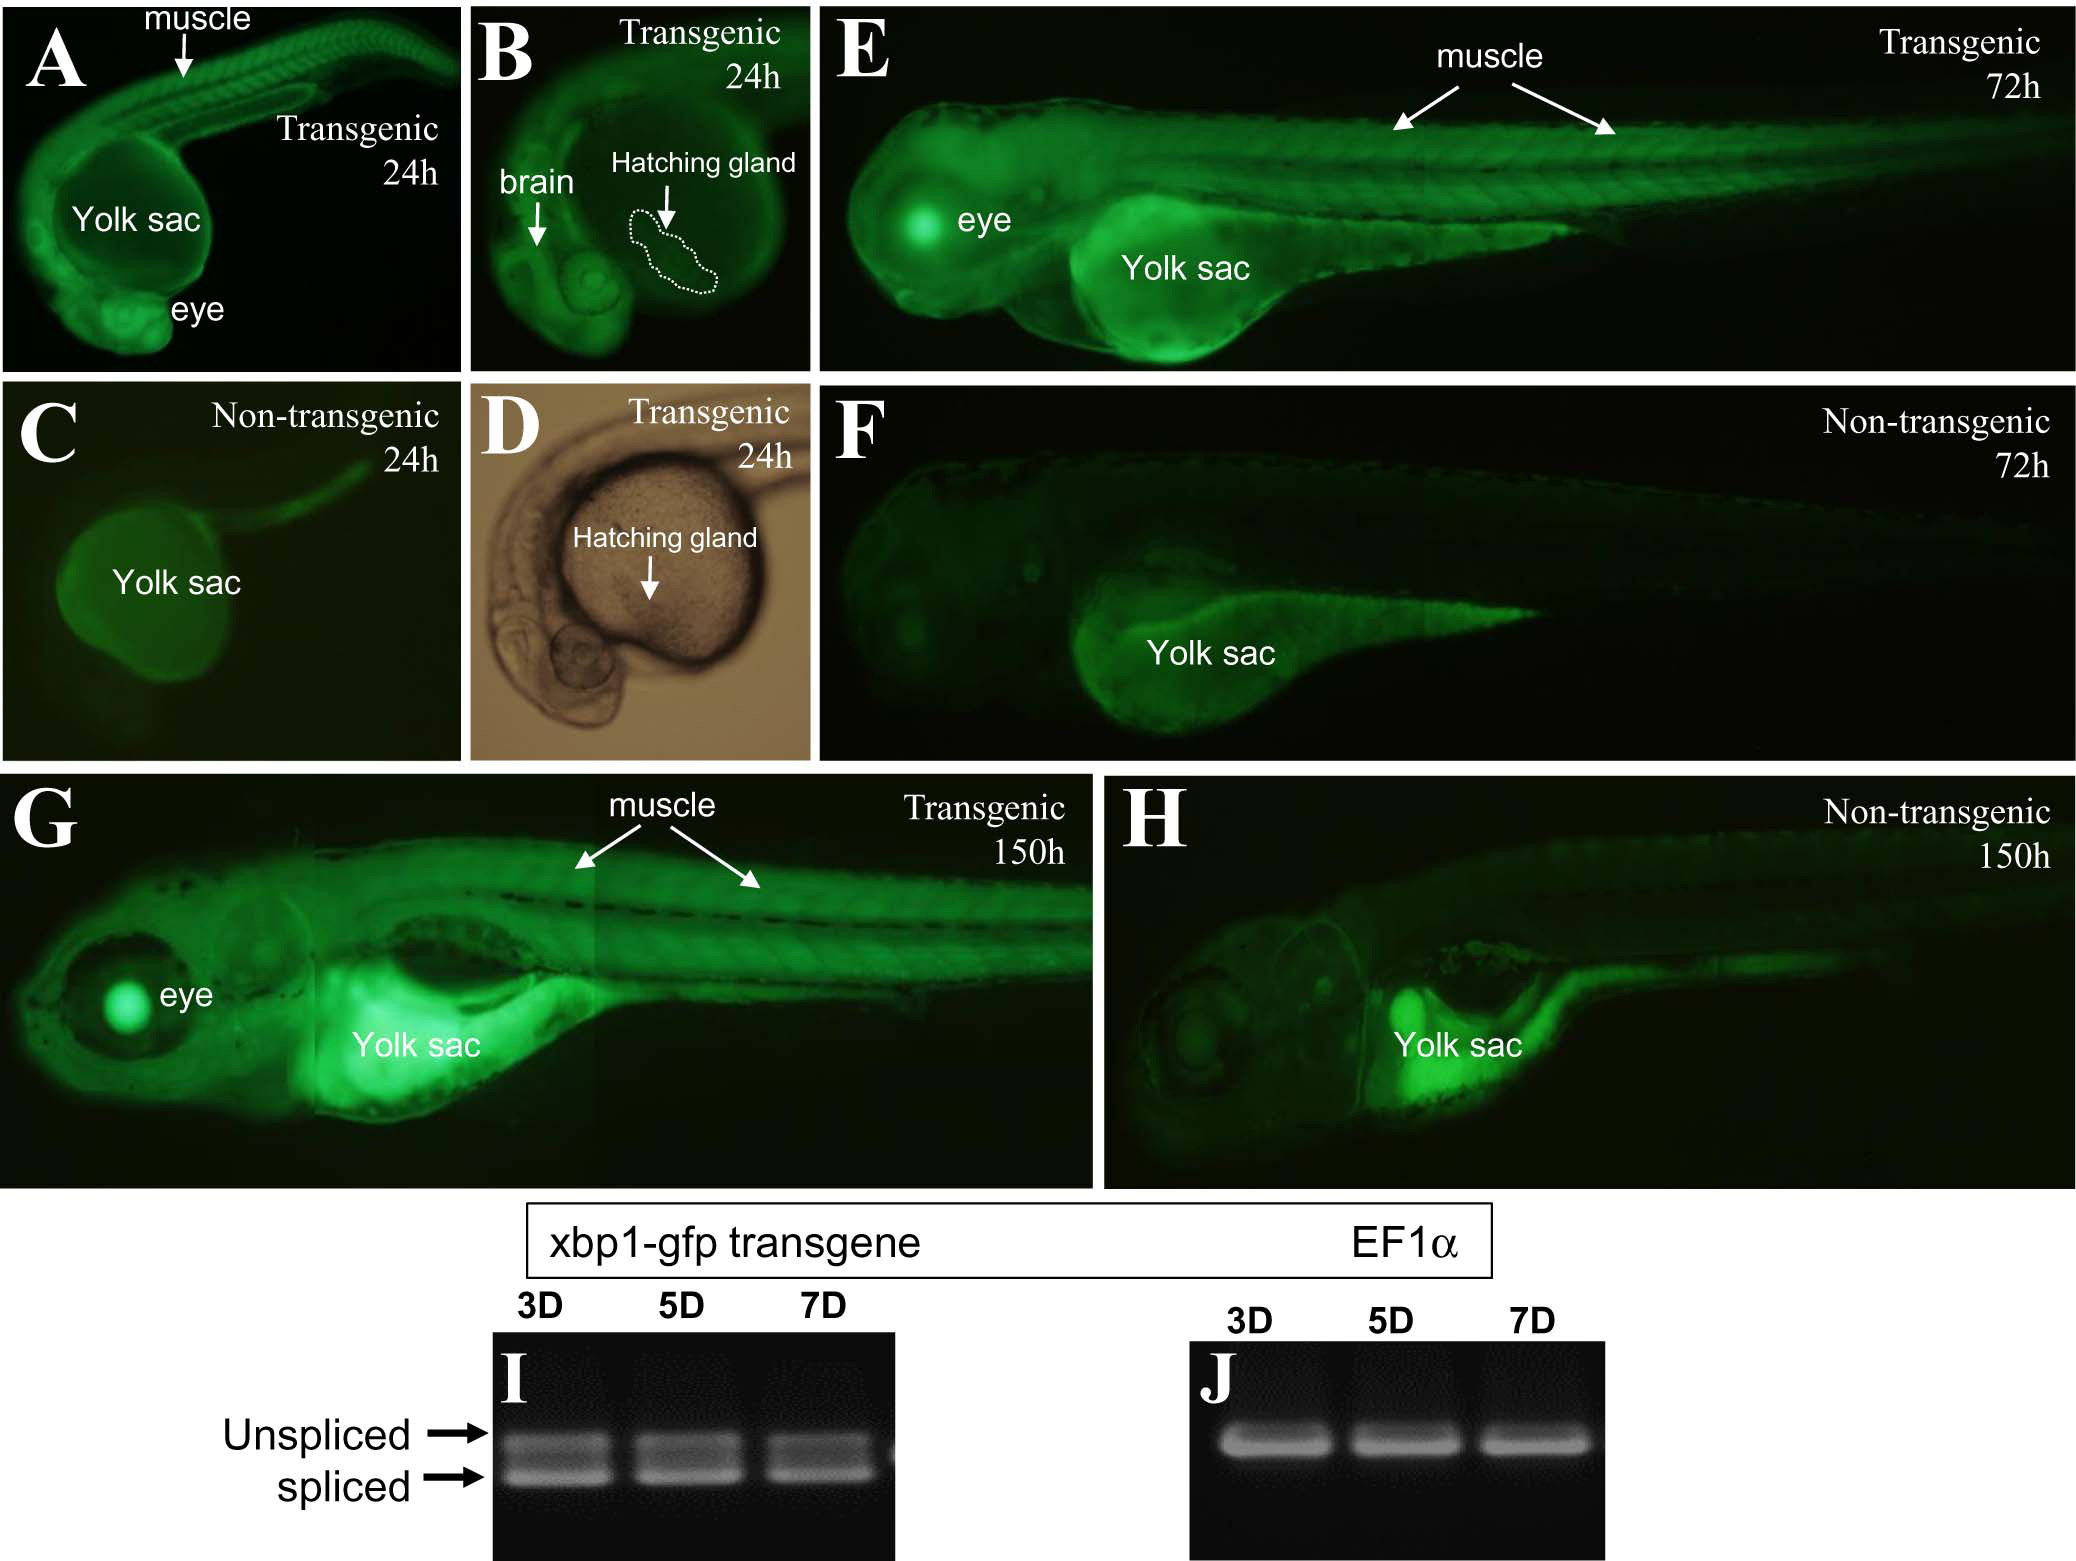
XBP1Δ-GFP expression in homozygous transgenic zebrafish larvae. (A and B) XBP1Δ-GFP expression in live Tg(ef1a:xbp1δ-gfp) transgenic zebrafish larvae at 24 hpf. (C) Non-transgenic fish larvae at 24 hpf with GFP filter. (D) Bright filed of Tg(ef1a:xbp1δ-gfp) transgenic zebrafish larvae at 24 hpf. (E and G) XBP1Δ-GFP expression in Tg(ef1a:xbp1δ-gfp) transgenic zebrafish larvae at 72 (C) or 150 (G) hpf. (F and H) Non-transgenic fish larvae at 72 (F) or 150 (H) hpf. (I and J) Expression and splicing of the Tg(ef1α:xbp1δ-gfp) transgene (I) or the elongation factor 1α (J) at day 3, 5 and 7.
Acknowledgments
This image is the copyrighted work of the attributed author or publisher, and
ZFIN has permission only to display this image to its users.
Additional permissions should be obtained from the applicable author or publisher of the image.
Reprinted from Mechanisms of Development, 137, Li, J., Chen, Z., Colorni, A., Ucko, M., Fang, S., Du, S.J., A transgenic zebrafish model for monitoring xbp1 splicing and endoplasmic reticulum stress in vivo, 33-44, Copyright (2015) with permission from Elsevier. Full text @ Mech. Dev.