
Fig. 8
- ID
- ZDB-IMAGE-151002-7
- Genes
- Publication
- Liu et al., 2015 - Apoc2 loss-of-function zebrafish mutant as a genetic model of hyperlipidemia
- All Figures
- Figures for Liu et al., 2015
|
Fig. 8
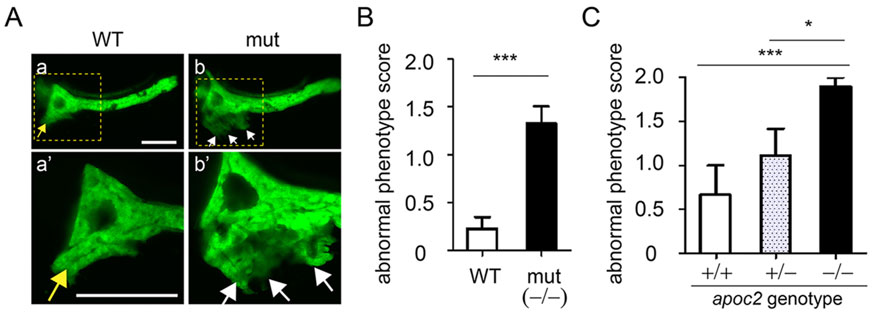
apoc2 mutants have ectopic pancreas outgrowth. (A) Images of pancreas, labeled with EGFP driven by the ptf1a promoter, in 6.5dpf WT and apoc2 mutant (mut) larvae. The yellow arrow points to the normal pancreatic growth and white arrows point to ectopic outgrowth. Scale bar: 100µm. (B,C) At 6.5dpf, an independent observer scored a pancreatic outgrowth phenotype as 0, normal, 1, mild and 2, severe. (B) WT (n=13) and apoc2-/- mutant (n=21). Results are mean±s.e.m.; ***P<0.001 (Student′s t-test). (C) Heterozygous apoc2+/- zebrafish carrying one copy of the ptf1a-EGFP transgene were crossed with the heterozygous apoc2+/- zebrafish carrying no ptf1a-EGFP. A total of 22 embryos that displayed EGFP fluorescence were selected, scored for the pancreas outgrowth defect and then genotyped. Random ptf1a-EGFP expression resulted in the following distribution of EGFP-positive embryos: apoc2+/+ (n=3), apoc2+/- (n=9) and apoc2-/- (n=10). Results are mean±s.e.m.; *P<0.05; ***P<0.001 (Student′s t-test).