
Image
|
Figure Caption
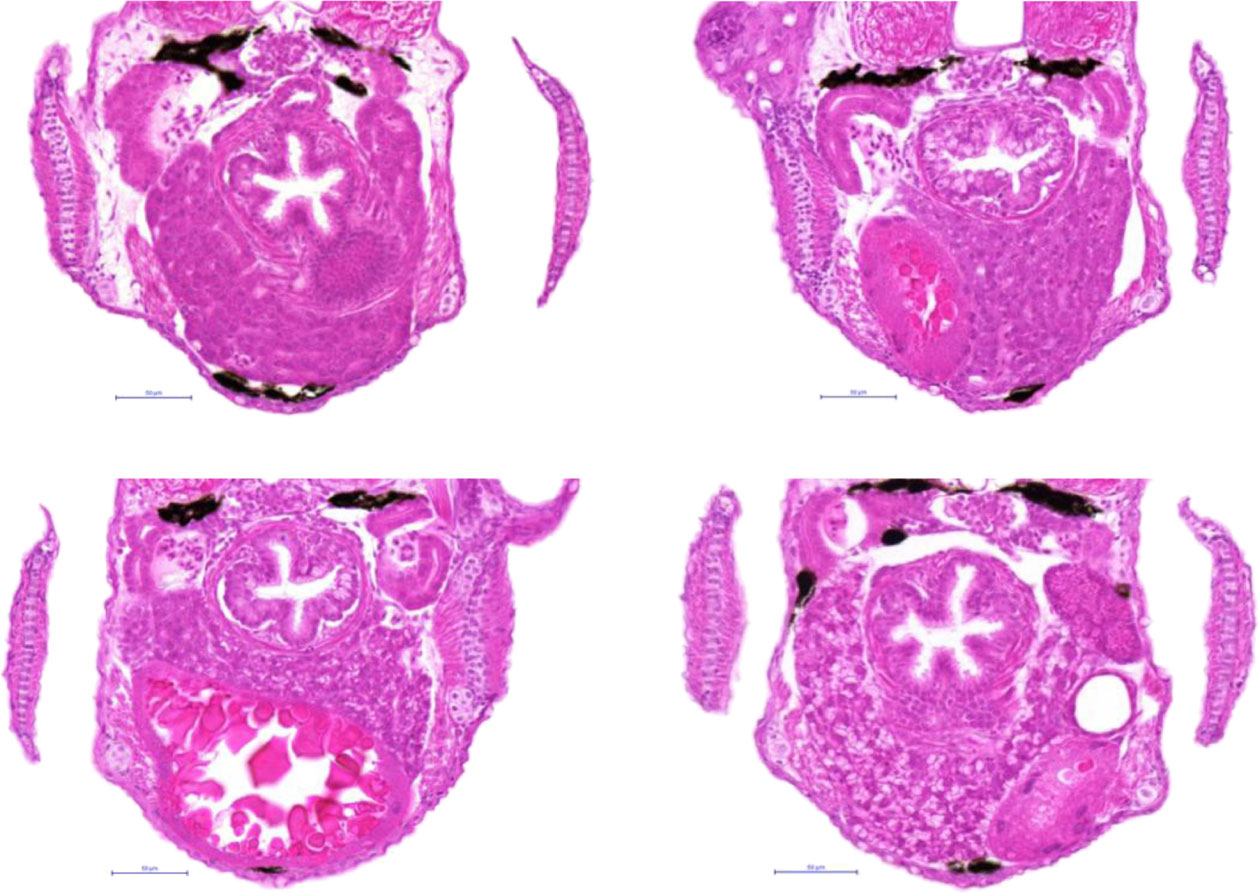
Fig. 3
Hepatocellular glycogen variation in control livers. Histopathological analysis of transversal HE sections of control larvae showing varying levels of glycogen accumulation from no observable accumulation (A), to minimal (B), very mild (C) and mild accumulation (D). Yellow border indicates the liver. Magnification 400×.
Acknowledgments
This image is the copyrighted work of the attributed author or publisher, and
ZFIN has permission only to display this image to its users.
Additional permissions should be obtained from the applicable author or publisher of the image.
Full text @ J. Appl. Toxicol.