
Image
|
Figure Caption
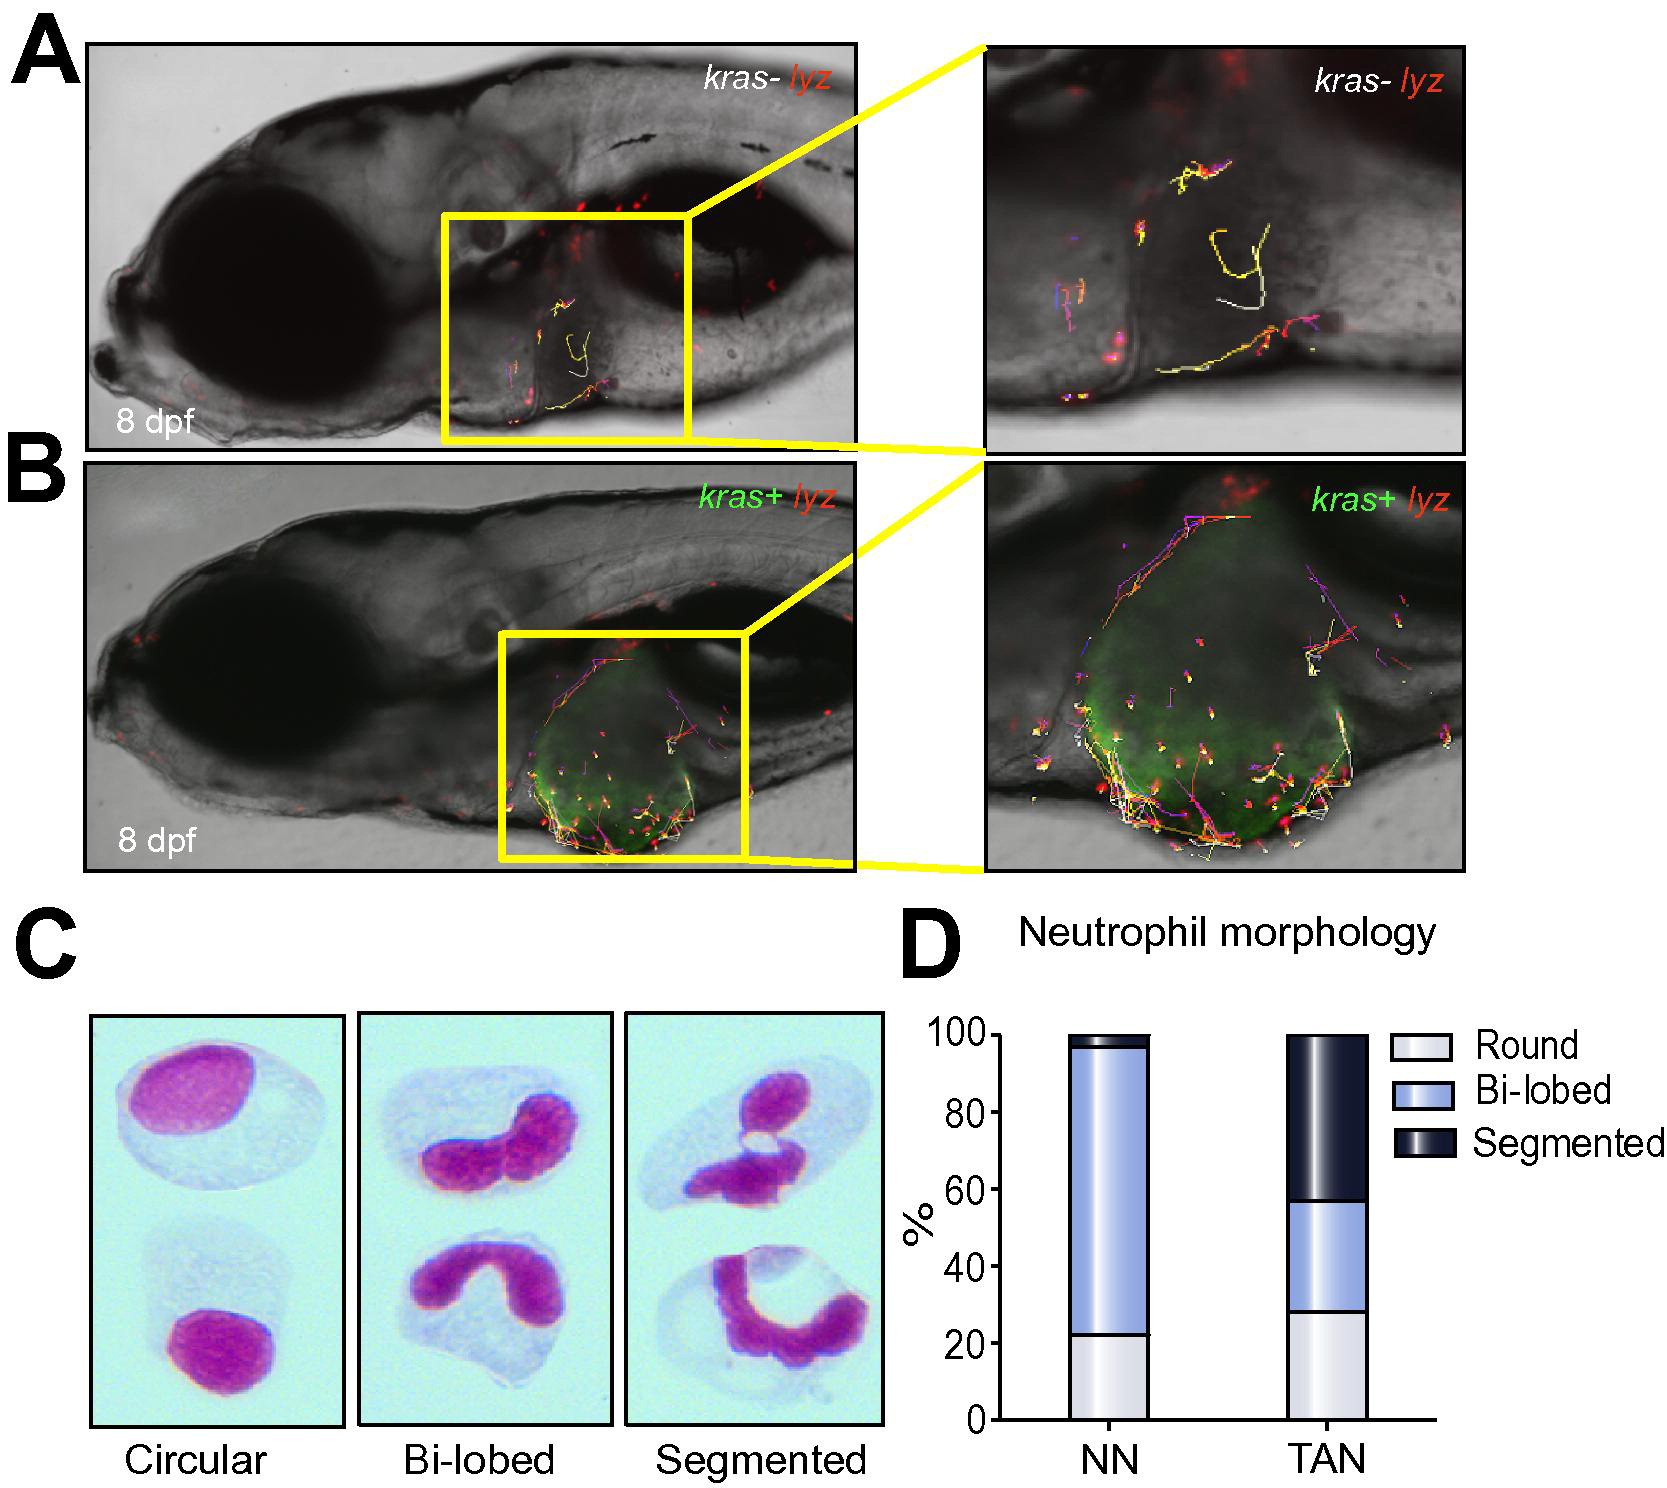
Fig. 4
Differential behaviors of NNs and TANs. (A–B) Tracking of neutrophil movement within and surrounding the liver area in a kras-/lyz+ larva (A) and a kras+/lyz+ larva (B) respectively. Selected neutrophils were tracked based on one-hour time-lapse videos on 8 dpf larvae in Supplementary Videos 1 and 2. (C) Representative images of three distinct nuclear patterns after Giemsa staining: circular, bi-lobed and segmented nuclei. (D) Percentages of each nuclear pattern in NNs and TANs.
Figure Data
Acknowledgments
This image is the copyrighted work of the attributed author or publisher, and
ZFIN has permission only to display this image to its users.
Additional permissions should be obtained from the applicable author or publisher of the image.
Reprinted from Journal of hepatology, 63(2), Yan, C., Huo, X., Wang, S., Feng, Y., Gong, Z., Stimulation of hepatocarcinogenesis by neutrophils upon induction of oncogenic kras expression in transgenic zebrafish, 420-8, Copyright (2015) with permission from Elsevier. Full text @ J. Hepatol.