
Fig. 6
- ID
- ZDB-IMAGE-150916-18
- Publication
- Simões et al., 2014 - Denervation impairs regeneration of amputated zebrafish fins
- All Figures
- Figures for Simões et al., 2014
|
Fig. 6
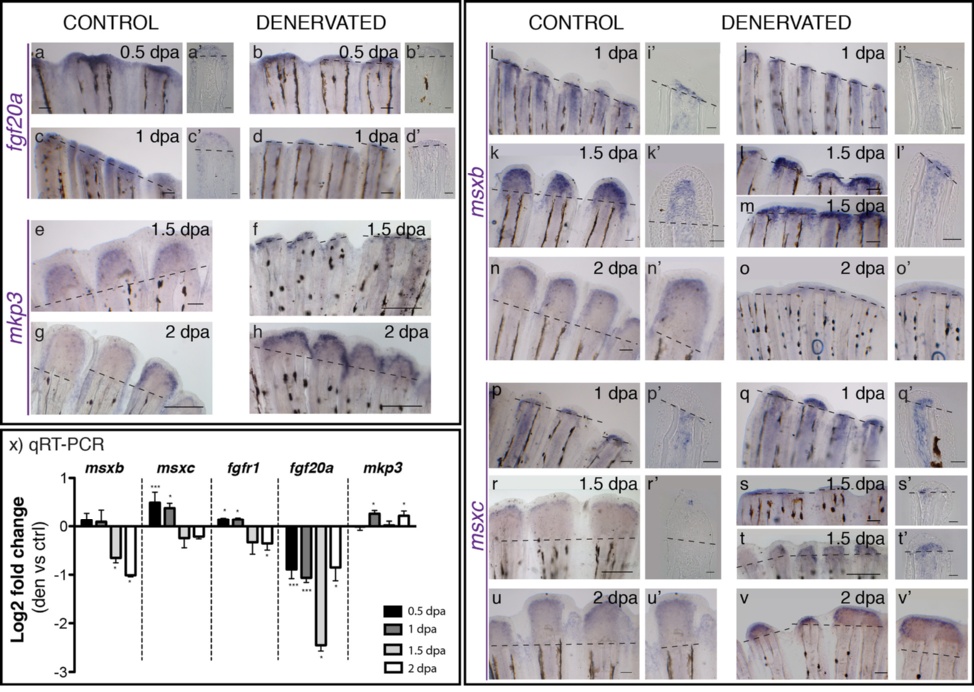
Gene expression in the blastema of control and denervated fins. a-v) mRNA ISH on whole mount amputated fins: fgf20a, mkp3, msxb, msxc.a′-l′, p′-t′) Longitudinal sections of the rays using whole mount ISH. a-d)Fgf20a expression is detected at 0.5 and 1 dpa in control fins (a,c) and only a residual expression is detected in denervated fins (b,d). e-k)Mkp3 is detected at 1.5 dpa in control (e) and denervated fins (f). At 2 dpa the expression in denervated fins is reduced but stronger (h) than in controls (g). i-o)Msxb expression starts at 1 dpa in both control and denervated fins. At 1.5 dpa denervated rays that have partially regenerated (m) present msxb expression spread in the inter-ray tissue (*). msxb expression is still detected at 2 dpa, however, in denervated fins is reduced to a thin domain (o). p-v)Msxc expression is present in both fins at 1 dpa, but with a stronger expression in denervated fins (q,q′). Expression is maintained after 1.5 dpa in non-regenerating (s,s′) and partially regenerating fins (t,t′). At 2 dpa, msxc is expressed as a continuum in the tip of partially regenerating denervated fins, in what seems a “merged blastema” (Adult zebrafish pectoral fin denervation assay.,v′). a,a′-v,v′) Dashed lines mark amputation plane. Scale bar - 100 µm in whole mount fins; 25 µm in sections. x) qRT-PCR for genes expressed in the blastema. qRT-PCR analysis shows an increase in the expression of msxc and fgfr1 on denervated fins at 0.5 and 1 dpa, as well as in mkp3 at 1 and 2 dpa, when compared to controls. Fgf20a levels of expression are always decreased in relation to the controls, as it is msxb at 1.5 and 2 dpa. Note: ***p < 0.0001, *p < 0.05.