
|
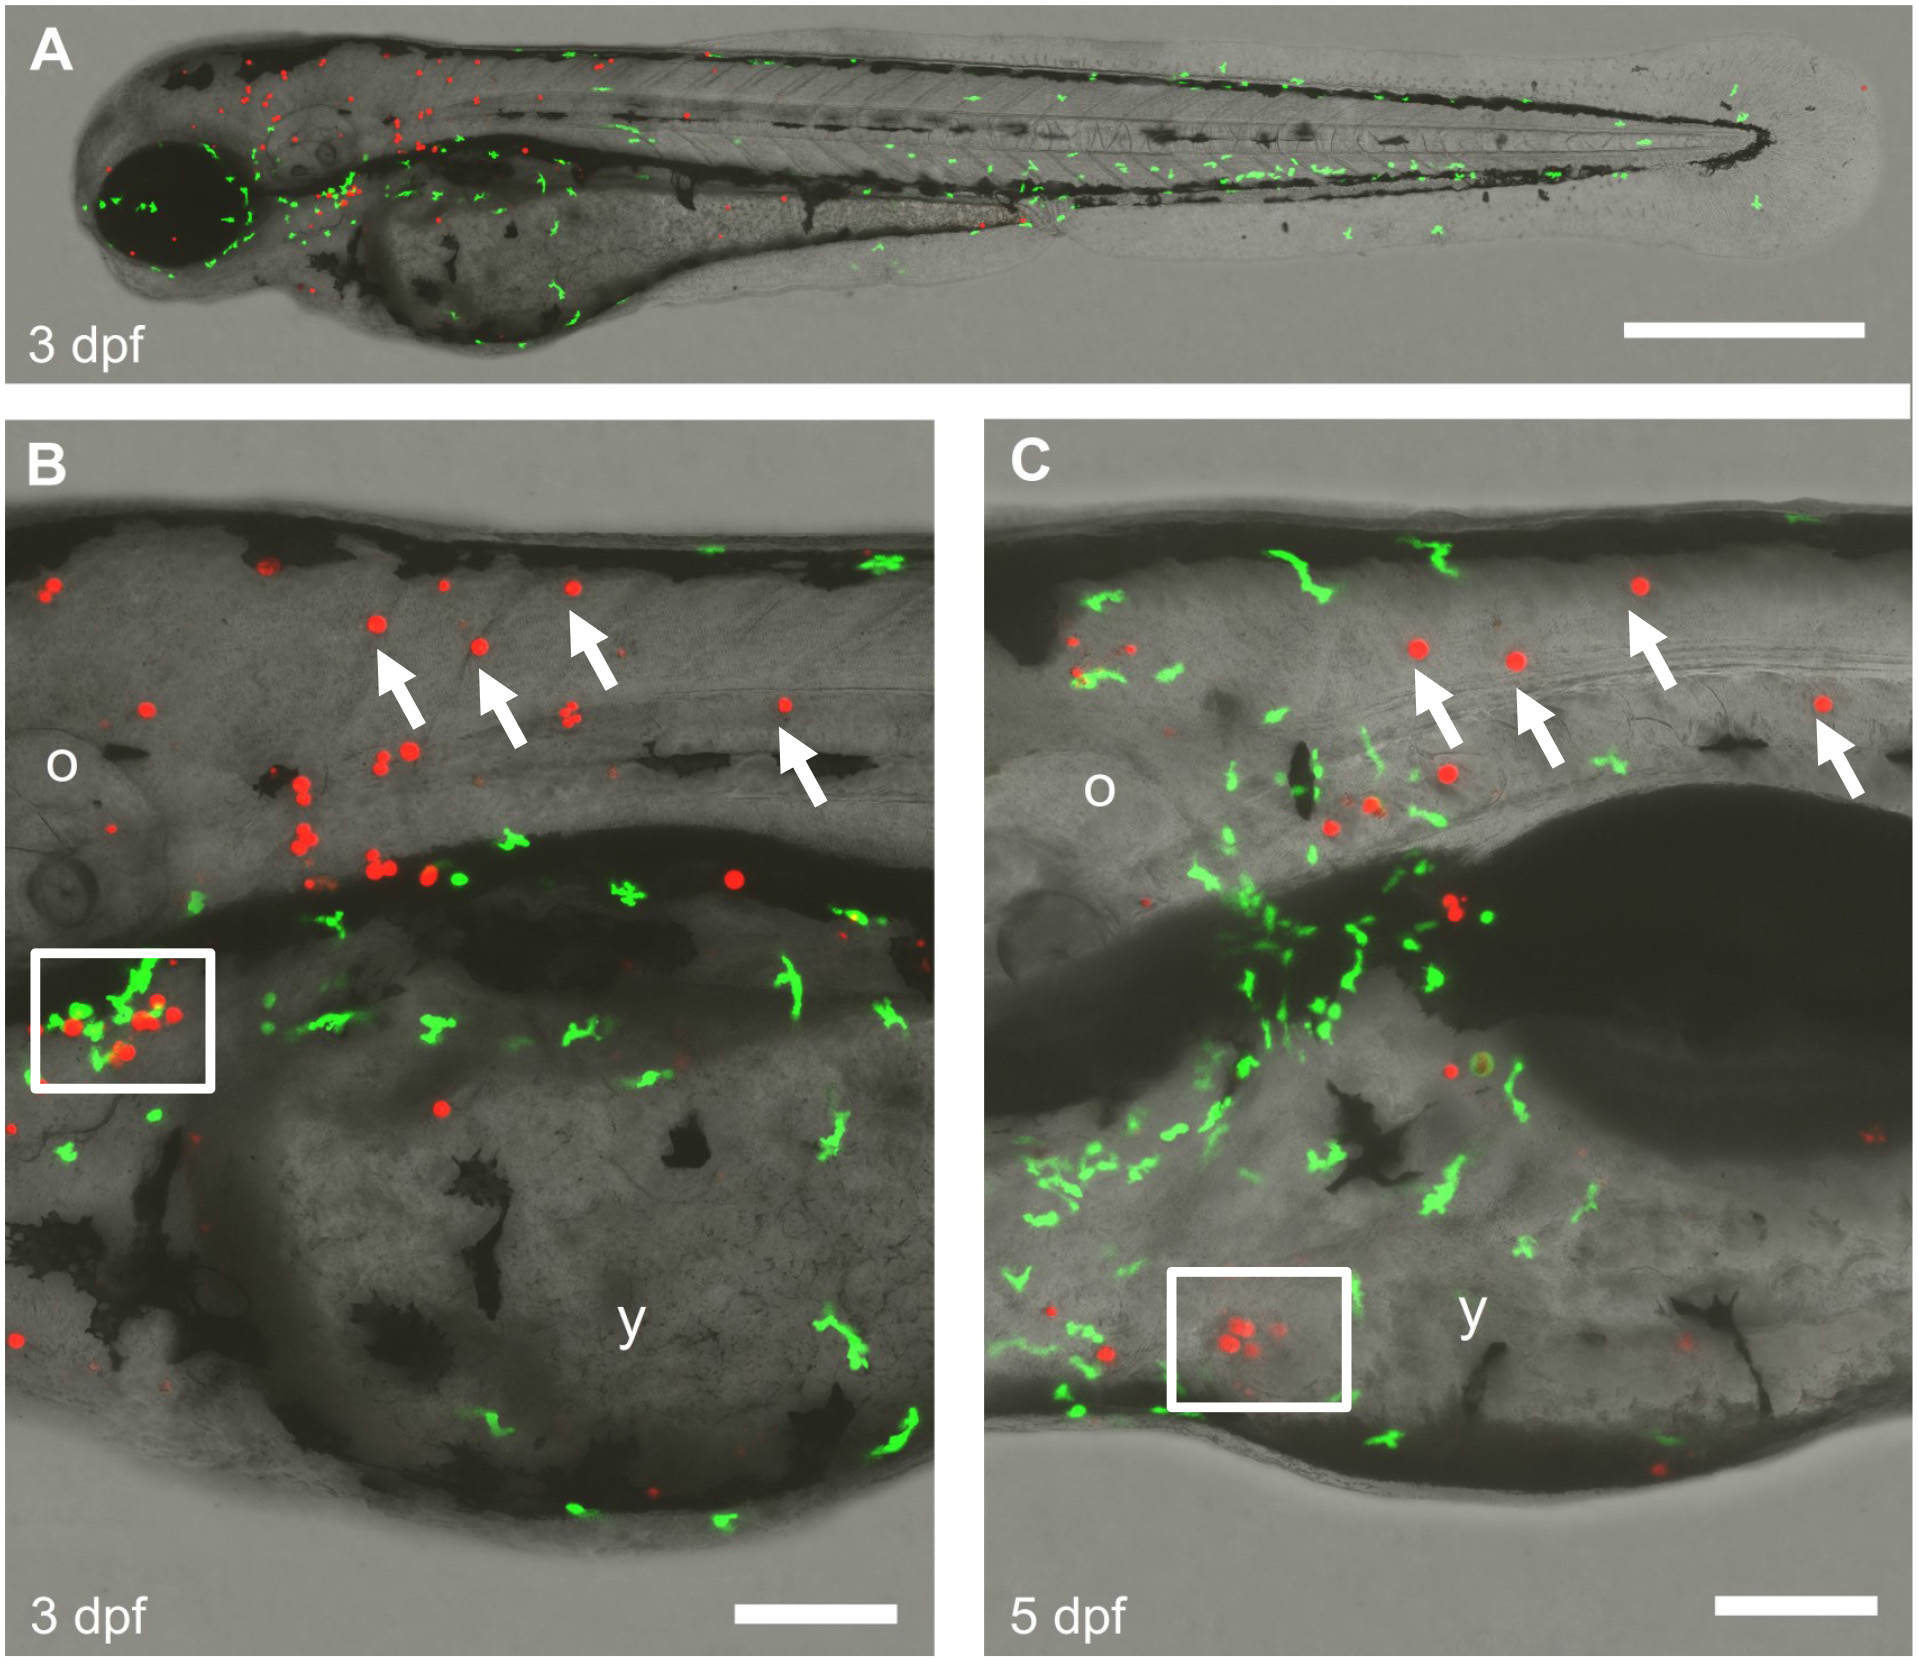
Fig. 5 Interaction of algae with the host innate immune system.
C. reinhardtii was injected in a BACmpx:GFP transgenic zebrafish embryo and raised until 3 days post fertilization (dpf). Larvae were imaged by confocal microscopy using the green and red channels to visualize the neutrophils (GPF) and algae (autofluorescence) respectively (A). A close up of the same region of the trunk is shown at 3 and 5 dpf (B-C). White arrows in B and C indicate C. reinhardtii persisting cells. The lower white square in B shows a group of cells cell that are not further seen in C, while the white square in C shows the opposite. The scale bar represents 500 µm in A and 100 µm in B-C. o, otic vesicle; y, yolk sack. n ≥ 3.