
|
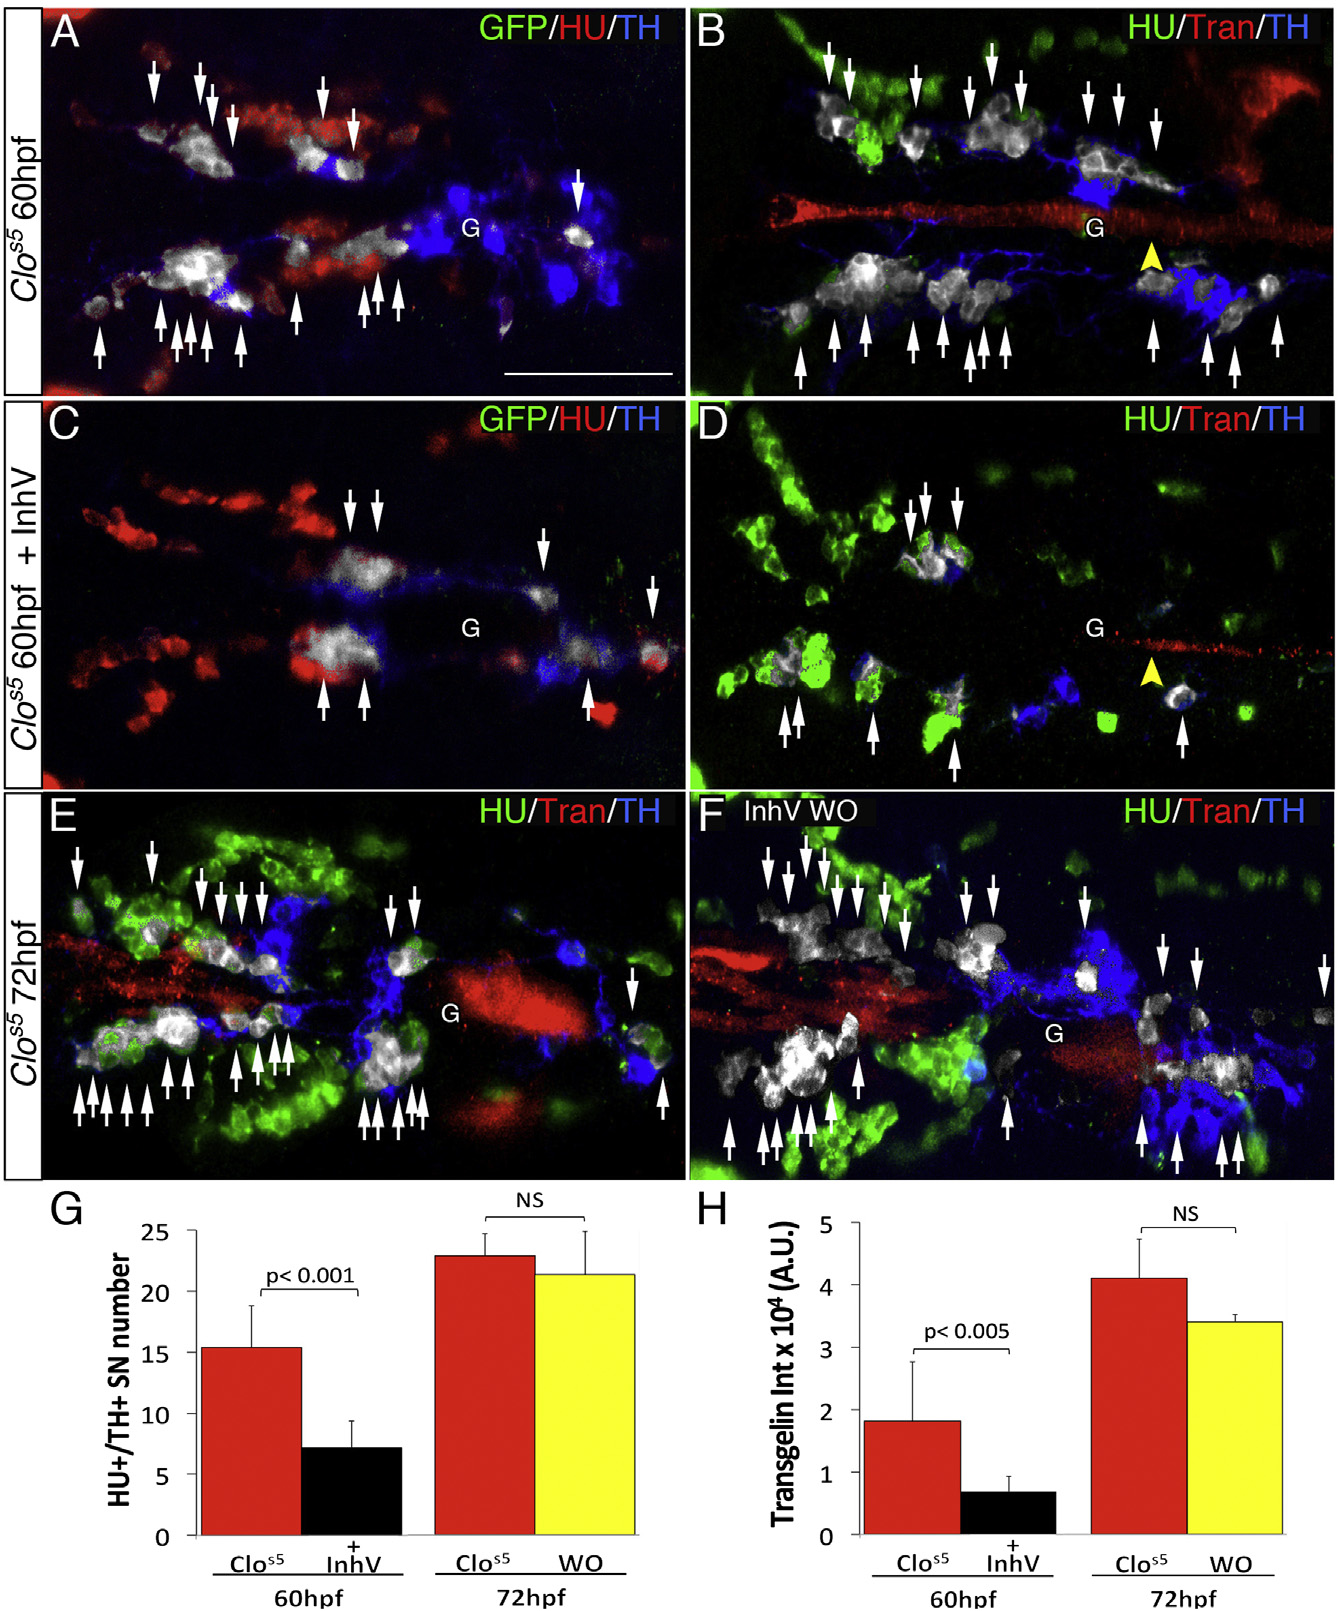
Fig. 7
Ectopic VMCs in clos5 Embryos Are Sufficient to Induce NA Differentiation
(A–F) Confocal analysis of clos5Tg(kdrl:EGFP) embryos. Dorsal views of the region between the LDA and the glomerulus (anterior is to the left). HU+/TH+ SNs are pseudocolored in white and indicated (arrows). (A and B) SNs develop in clos5 mutant embryos in the absence of endothelial cells (A) and the presence of VMCs (B). Arrowhead indicates VMC coverage in clos5 mutant embryos. (C and D) clos5 embryos treated with 1 µM of PDGFR inhibitor InhV (D) or DMSO (C) between 48 and 60 hpf. Arrowhead indicates the reduced VMC coverage in clos5 PDGFR inhibitor-treated embryos (D). Note presence of HU+ cells but fewer HU+/TH+ SNs (white arrows) in clos5 embryos treated with 1 µM PDGFR inhibitor. (E and F) clos5 embryos treated with 1 µM of PDGFR inhibitor InhV between 48 and 60 hpf were maintained in control conditions for an additional 12 hr (60–72 hpf). SN morphogenesis and NA differentiation recovered following InhV withdrawal (F).
(G) Quantification of HU+/TH+ SNs in clos5 mutant embryos.
(H) Quantitative analysis of Transgelin fluorescence intensity of the clos5 mutant embryos. Data were calculated from three independent experiments.
NS, not significant; error bars indicate SD. A.U., arbitrary units; G, glomerulus; hpf, hours post-fertilization. Scale bar, 75 µm (A–F). See also Figure S6.