
|
Fig. 4
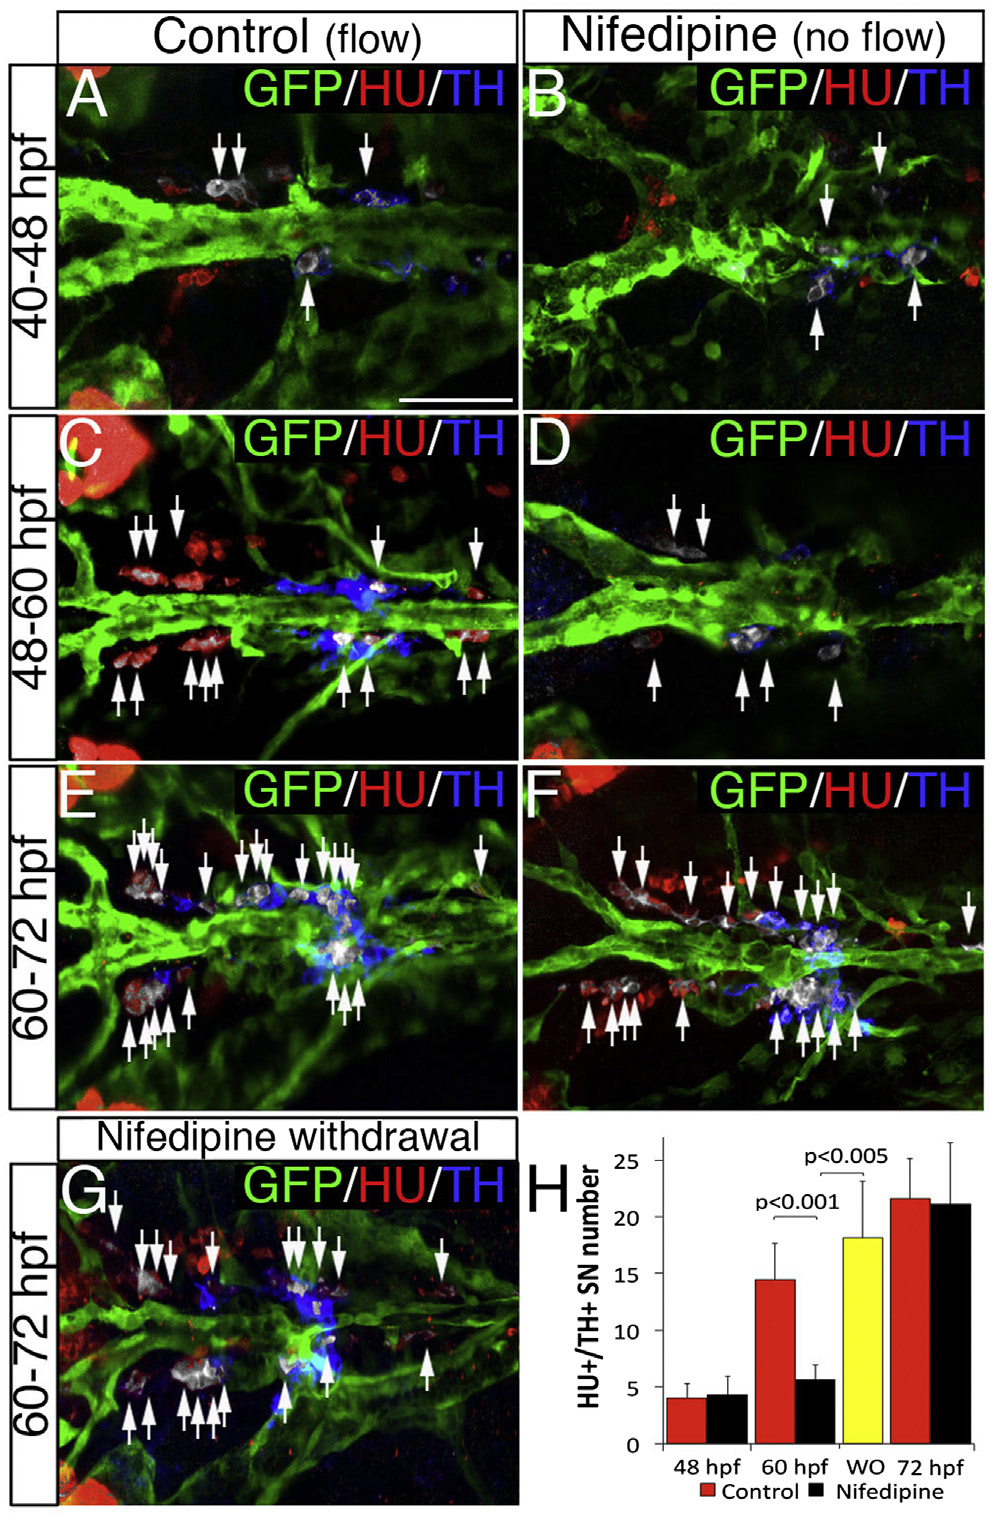
NA Differentiation of SNs Requires Blood Flow
(A–F) Dorsal views (anterior is to the left) of control (A, C, and E) or nifedipine-treated (B, D, and F) Tg(kdrl:EGFP)la116 zebrafish embryos. HU+/TH+ SNs are pseudocolored in white and indicated (arrows). Nifedipine was used to arrest blood flow during the periods indicated on the left. Treatment with 40 µM Nifedipine from 40–48 hpf or from 60–72 hpf does not affect the NA differentiation of SNs (A, B, E, F, and H). Nifedipine treatment from 48 to 60 hpf significantly decreases NA differentiation of SNs (C, D, and H).
(G) After nifedipine exposure between 48 and 60 hpf, the drug was withdrawn and embryos were maintained in control conditions for an additional 12 hr (60–72 hpf). NA differentiation recovered following nifedipine withdrawal.
(H) Quantification of HU+/ TH+ SNs in control (red bars), nifedipine-treated (black bars), and nifedipine-withdrawal (WO) (yellow bar) embryos. Data were calculated from three independent experiments.
Error bars indicate SD. Hpf, hours post-fertilization. Scale bar, 50 µm (A–G). See also Figure S3.