
Fig. 4
- ID
- ZDB-IMAGE-150827-5
- Genes
- Publication
- Ruf-Zamojski et al., 2015 - Spatio-Temporal Differences in Dystrophin Dynamics at mRNA and Protein Levels Revealed by a Novel FlipTrap Line
- All Figures
- Figures for Ruf-Zamojski et al., 2015
|
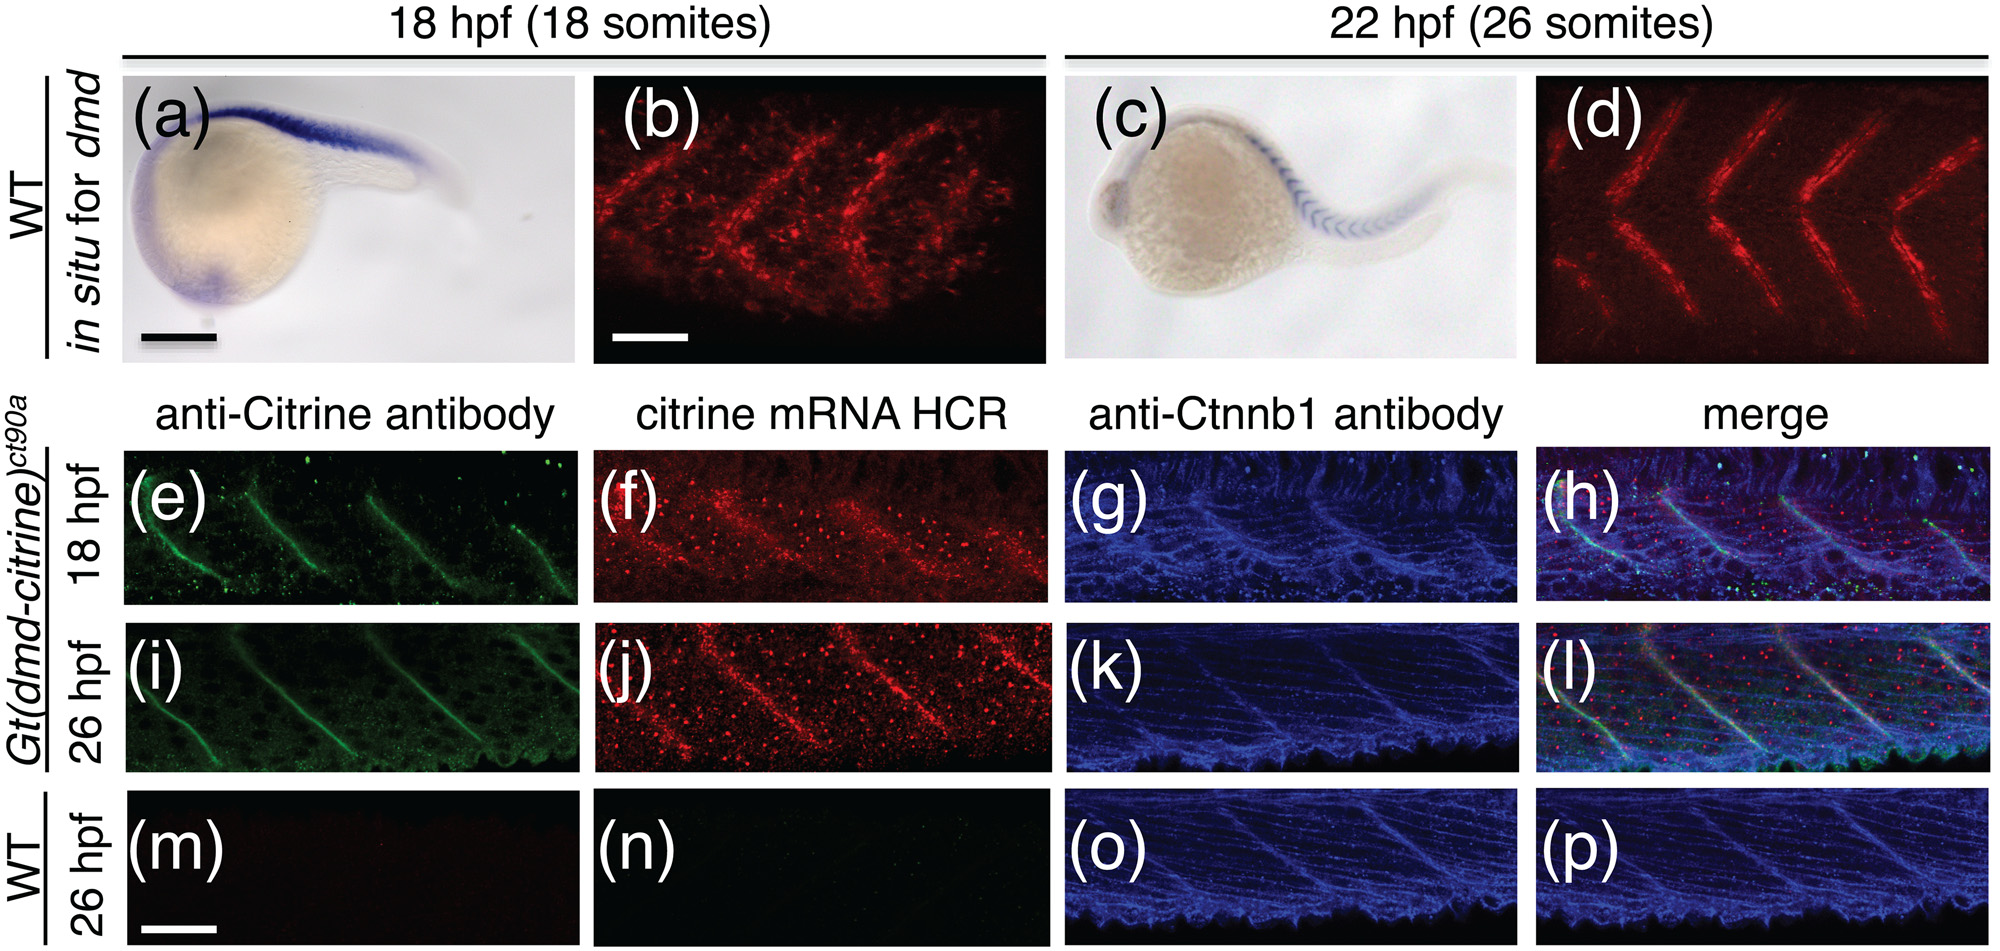
Fig. 4 dmd mRNA and Dmd protein expression show differences in spatial expression.
(a-d). Chromogenic in situ hybridization for dmd in wild type embryos at 18hpf (a,b) and 22hpf (c,d). (a,c) Wide field image of 18hpf and 22hpf embryos stained for dmd expression. (b,d) 3D projections of confocal z-stack of embryos in (a) and (c), respectively. Fluorescent signal of NBT/BCIP stain for dmd transcript reveals spatial confinement of transcript between somites. (e-p). Confocal image of dmd-citrine transcript (f,j,n) detected by in situ HCR and antibody staining for DMD-citrine protein (e,i,m) in Gt(dmd-citrine)ct90a (e-l) and wildtype (m-p) embryos at 18hpf and 26hpf. Counter-stain with antibody to Ctnnb1 in blue (g,k,o). (h,l,p) Merged of image of (e-g, i-k, and m-o). Comparison of protein and transcript expression at 18hpf (e-h) and 26 hpf (i-l) in Gt(dmd-citrine)ct90a embryos show that DMD protein localize exclusively to the myosepta while dmd-citrine mRNA is expressed in the cytoplasm at 18hpf and becomes more localized to the myosepta at 26hpf. Dmd-citrine expression in the nucleus can be seen as dots that appear similar in distribution between 18hpf and 26hpf. (m-p) DMD-citrine protein (m) and transcript (n) are not detected in wildtype embryos. Anti-Citrine antibody staining is in green, citrine mRNA HCR is in red and anti-Ctnnb1 antibody is in blue. Scale bars (a) 50µm (b,m) 20 µm.