
Fig. 1
- ID
- ZDB-IMAGE-150827-2
- Genes
- Publication
- Ruf-Zamojski et al., 2015 - Spatio-Temporal Differences in Dystrophin Dynamics at mRNA and Protein Levels Revealed by a Novel FlipTrap Line
- All Figures
- Figures for Ruf-Zamojski et al., 2015
|
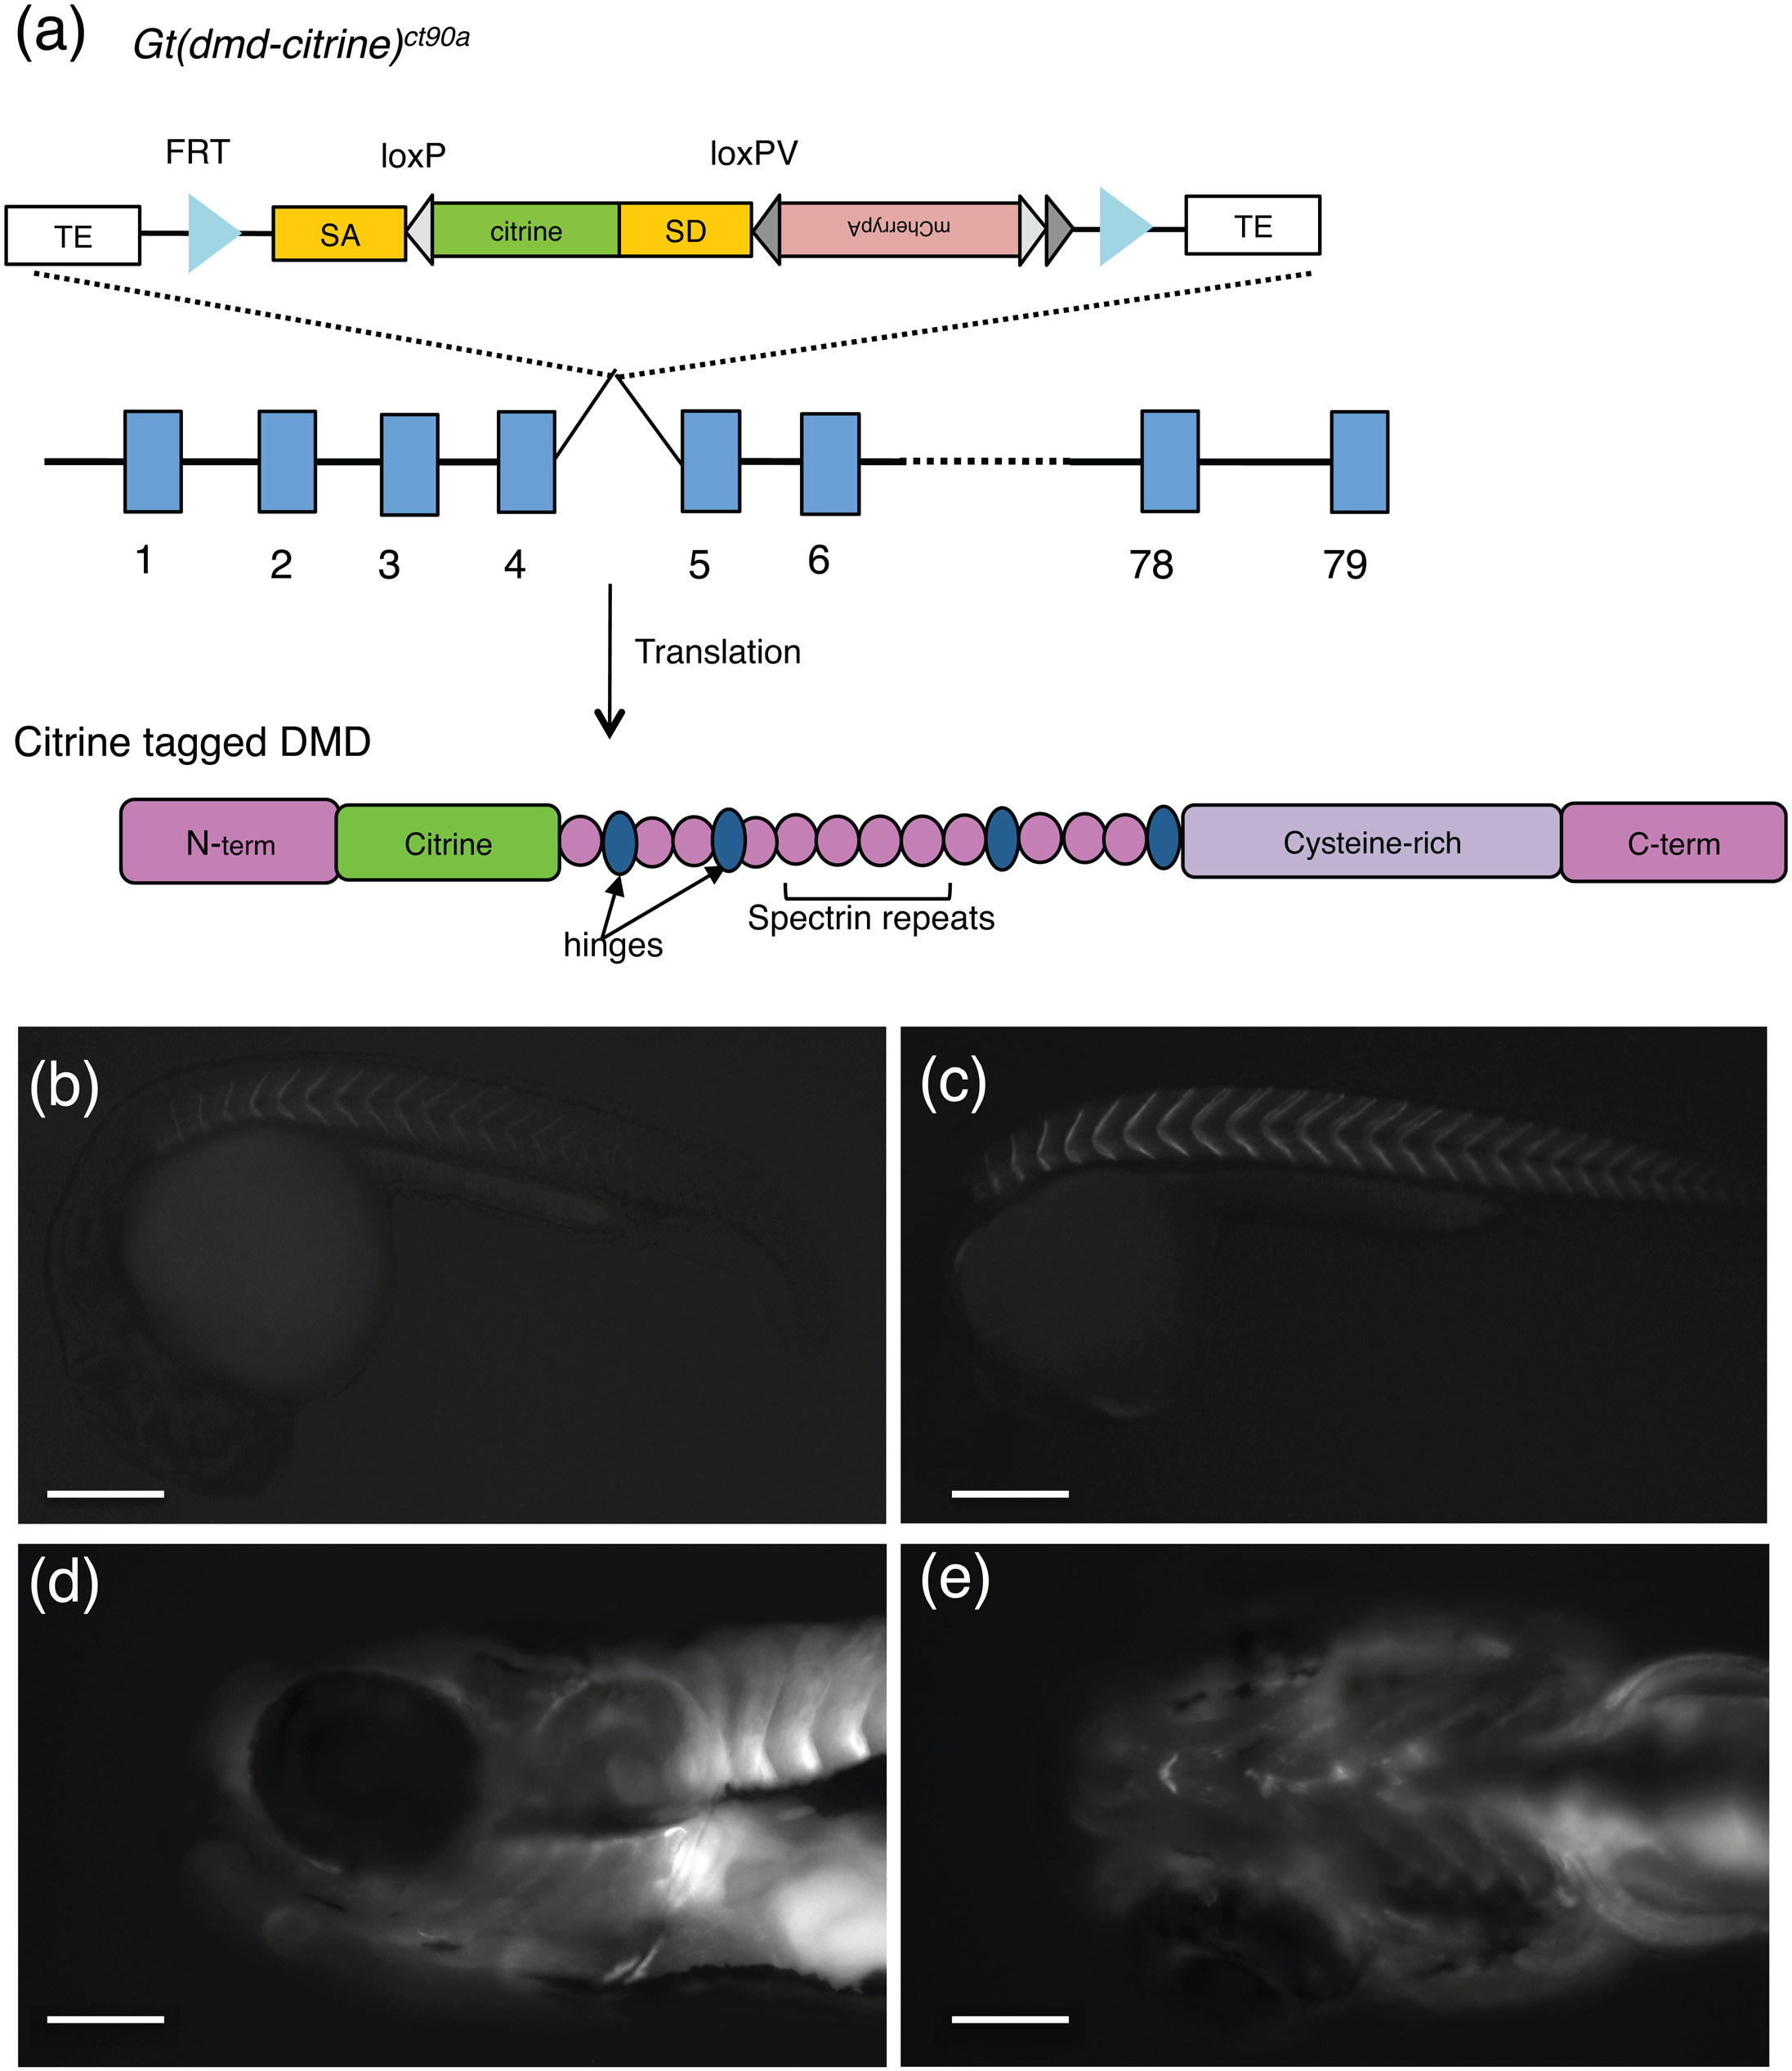
Fig. 1 FlipTrap Gt(dmd-citrine)ct90a line allows visualization of Dmd protein.
(a). Schematic of the FlipTrap vector inserted within dmd locus. Citrine insertion (green) occurs within intron 4–5 in dmd in the Gt(dmd-citrine)ct90a trap line (top) and upon translation produces a fluorescently tagged full-length functional Dmd protein (bottom). The exons (blue rectangles), introns (blank line) and domains of the protein are not drawn to scale. (b-e). Wide-field fluorescent images of Dmd-Citrine expression in the Gt(dmd-citrine)ct90a line, in the trunk skeletal muscles (b-c) at 24hpf (b) and 32hpf (c); (d-e). Expression in the cranial skeletal muscle at 6dpf (lateral (d) and ventral (e) views). Ventral view showing expression in the skeletal muscle of the branchial arches. Scale bars: (b)-(c) 100µm, (d)-(e) 25µm.