
Fig. 4, S1
- ID
- ZDB-IMAGE-150826-9
- Publication
- Auer et al., 2015 - Deletion of a kinesin I motor unmasks a mechanism of homeostatic branching control by neurotrophin-3
- All Figures
- Figures for Auer et al., 2015
|
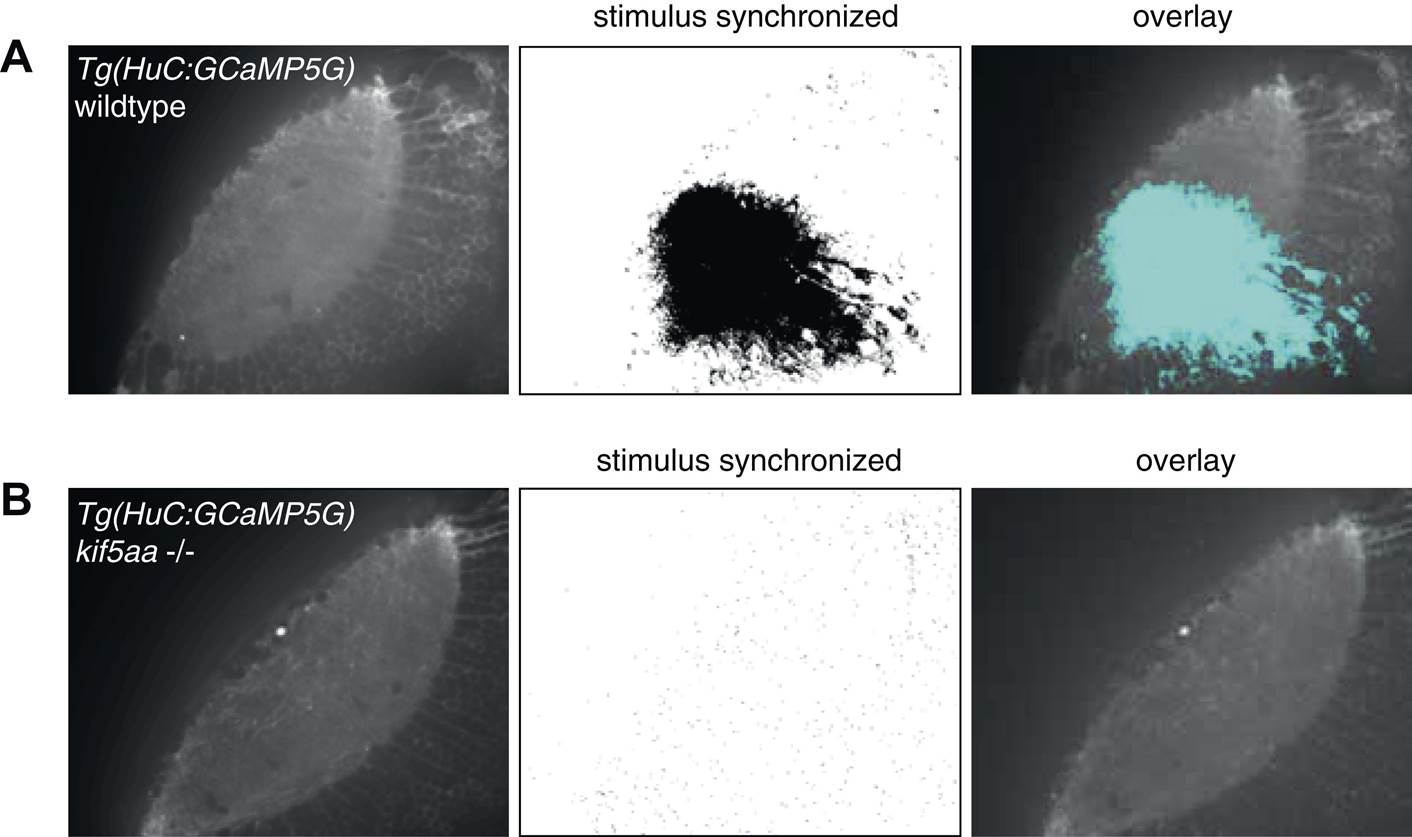
Fig. 4, S1 Regression-based analysis of wild-type/heterozygous vs kif5aa/ Tg(HuC:GCaMP5G) mutants to a visual stimulus.
Kif5aa sibling and mutant Tg(HuC:GCaMP5G) larvae were stimulated with a visual bar running from caudal to rostral in the visual field. Subsequently, regression analysis of the measured Calcium time-series and a time-series representing an expected calcium response to the stimulus was performed (Miri et al., 2011). In wild-type/heterozygous a large number of correlated pixels could be identified spanning the neuropil and PVN layers (A), whereas in kif5aa mutants no pixels were activity correlated with the stimulus (B).