
|
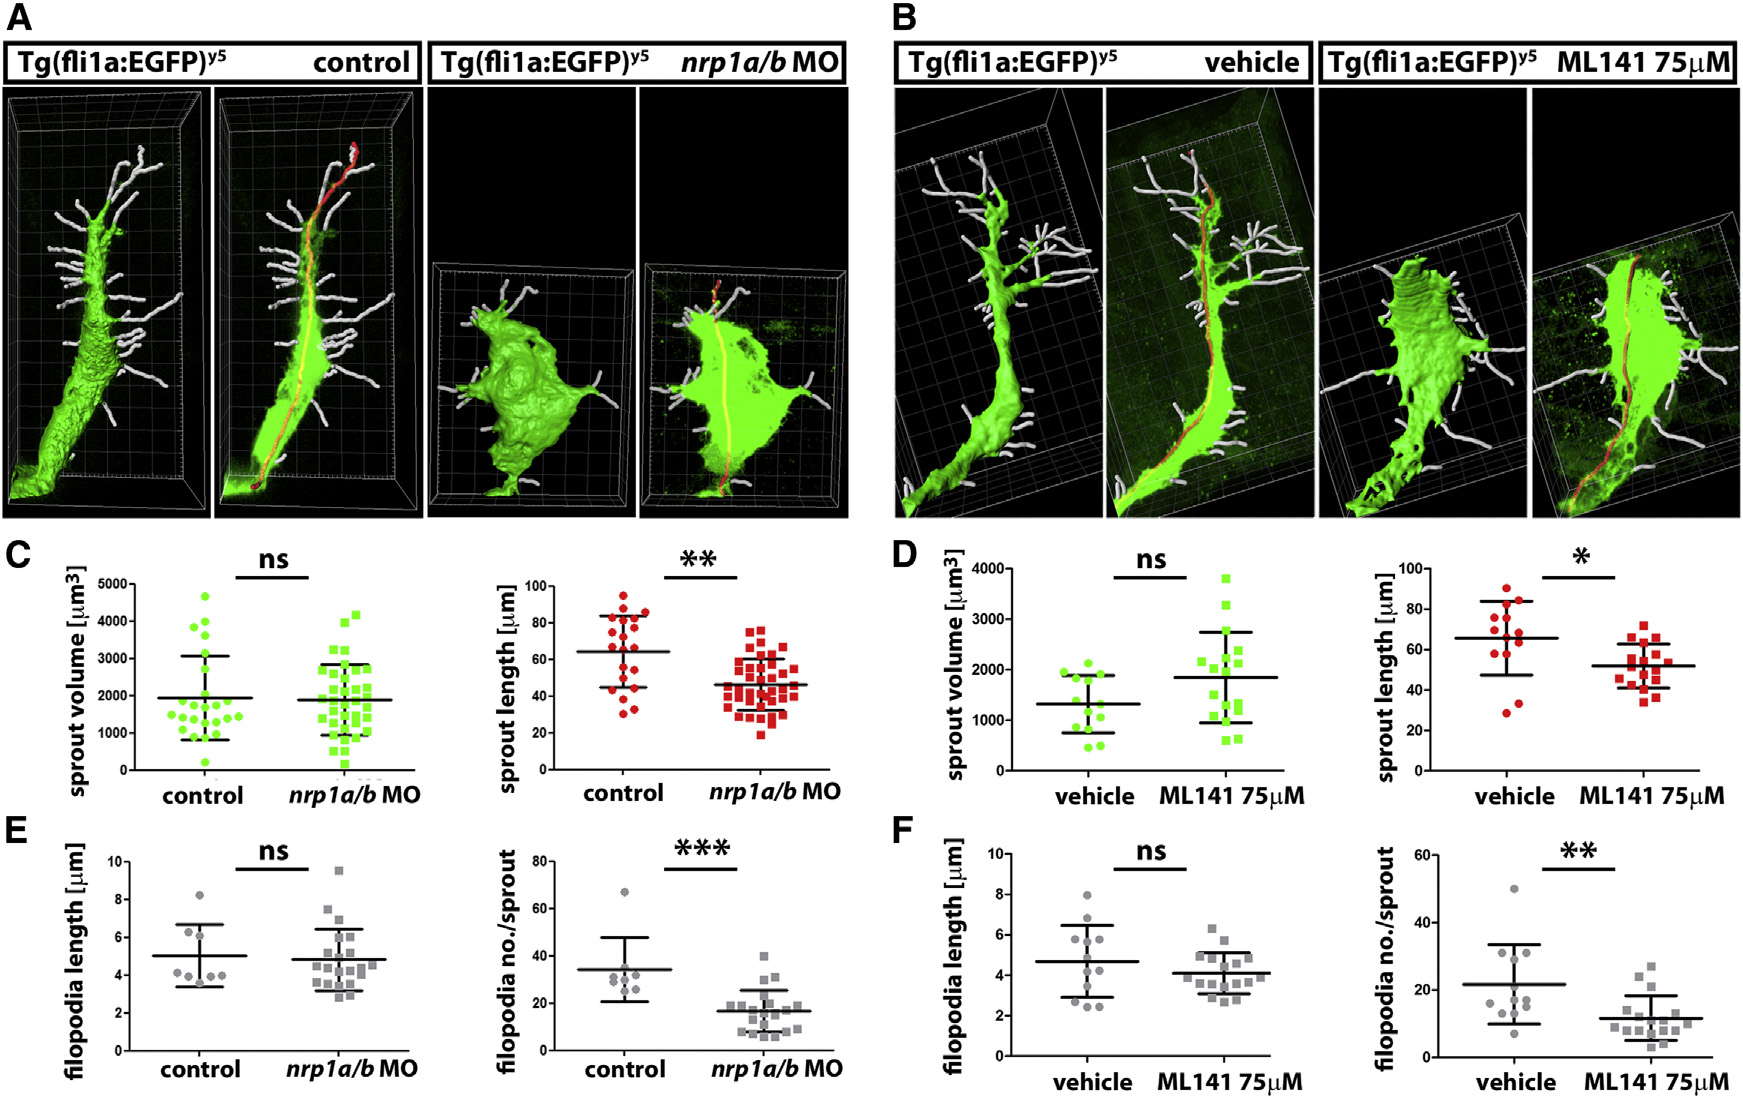
Fig. 6
Cdc42 Inhibition Phenocopies Nrp1 Knockdown during Zebrafish Angiogenesis
(A and B) Imaris image analysis of ISV sprouts in nrp1 morphant, ML141-treated and control embryos to determine sprout volume via surface rendering (left panel for each condition) and filament tracing to determine sprout length (red line in the right panel for each condition) and filopodia number as well as filopodia length (white lines). Grid ticks, 1 µm.
(C–F) Quantitative analysis of the Imaris images exemplified in (A and B) for sprout volume and sprout length (C and D), filopodia length and filopodia number (E and F); mean ± SD, n e 8 sprouts for nrp1 morphant relative to control treated fish (C and E) and ML141- versus vehicle-treated fish (D and F); asterisks indicate p < 0.05, p < 0.01, p < 0.001, and ns > 0.05.