
Fig. S1
- ID
- ZDB-IMAGE-150810-6
- Publication
- Evason et al., 2015 - Identification of Chemical Inhibitors of β-Catenin-Driven Liver Tumorigenesis in Zebrafish
- All Figures
- Figures for Evason et al., 2015
|
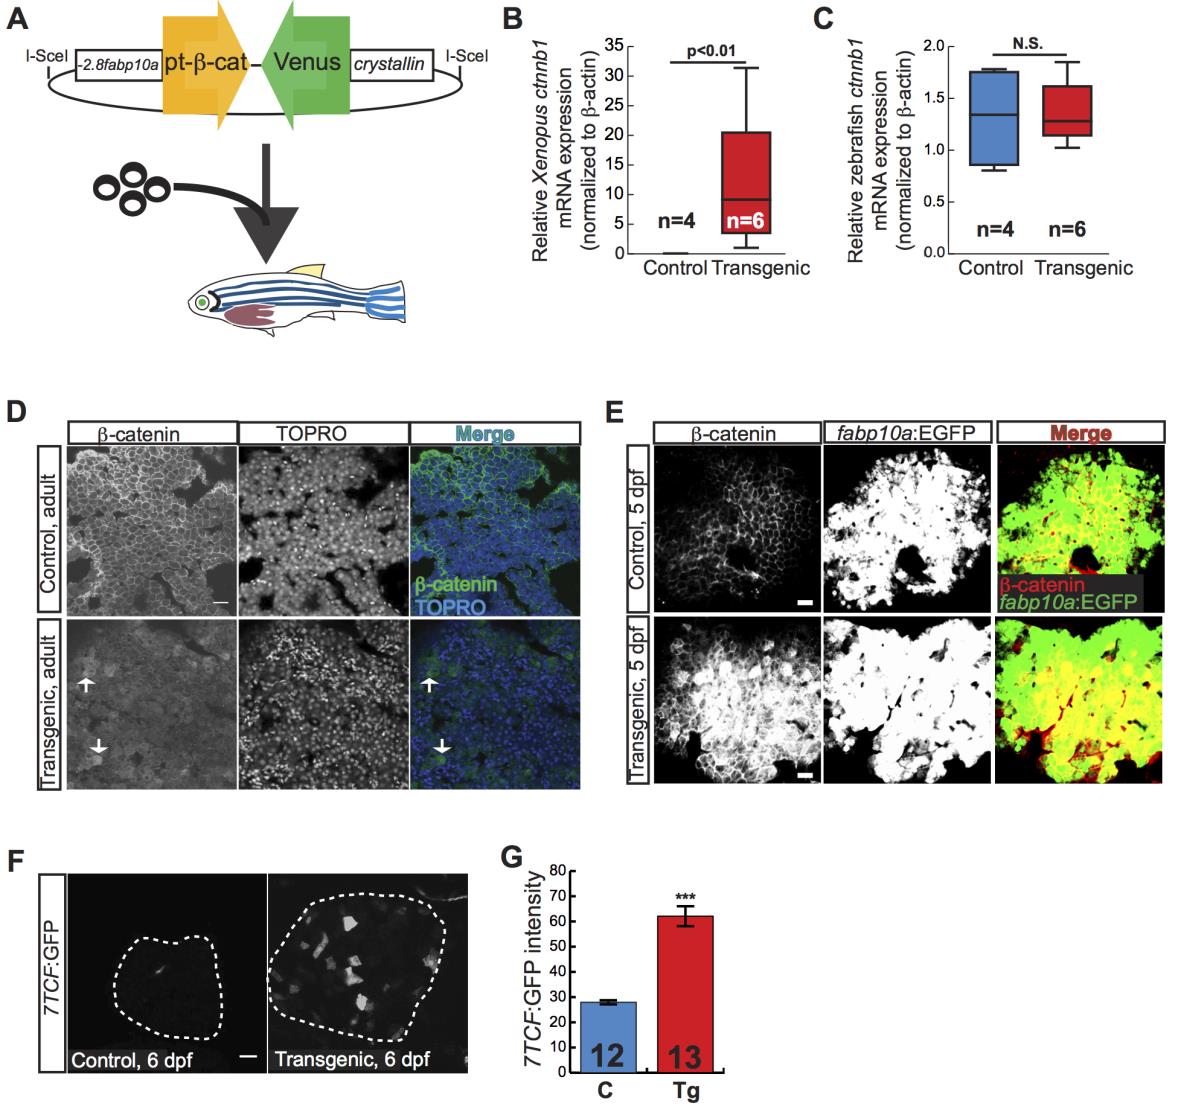
Fig. S1 Tg(fabp10a:pt-β-cat) zebrafish express activated β-catenin.
(A) Plasmid encoding hepatocyte-specific pt-β-catenin and a fluorescent eye marker was injected into embryos to generate Tg(fabp10a:pt-β-cat, cryaa:Venus) zebrafish. (B-C) Normalized transgenic Xenopus (B) and endogenous zebrafish (C) ctnnb1 mRNA expression in control and transgenic adult zebrafish livers. Three technical replicates were performed for each sample. Groups were compared using Mann-Whitney test. N values are shown above the x-axis. (D) Immunofluorescence of adult control sibling zebrafish liver cryosections (top panels) show membrane localization of β-catenin, whereas transgenic zebrafish livers show patchy cytoplasmic β-catenin staining and scattered β-catenin-positive nuclei (arrows). (E) Similarly, whole-mounted 5-day-old control sibling larvae (top row) show membrane localization of β-catenin while transgenic zebrafish (bottom row) show patchy strong cytoplasmic and nuclear β-catenin staining. Immunofluorescent staining for β-catenin was performed in Tg(fabp10a:EGFP) larvae, which have green hepatocytes; merged images show β-catenin is expressed in hepatocytes. (F) Six-day-old control sibling larvae (left) show essentially no 7xTCF-Xla.Siam:GFP (Wnt reporter) expression in hepatocytes, while transgenic larvae (right) show scattered hepatocytes with moderate to strong GFP positivity. (G) Fluorescence intensity ± standard error of the mean (SEM) was quantified using ImageJ, and samples were compared using the Student’s t-test (***, p<0.001). Scale bars, 20 µm. N values are shown above the x-axis.