
Fig. 5
- ID
- ZDB-IMAGE-150805-20
- Genes
- Publication
- Labalette et al., 2015 - Molecular dissection of segment formation in the developing hindbrain
- All Figures
- Figures for Labalette et al., 2015
|
Fig. 5
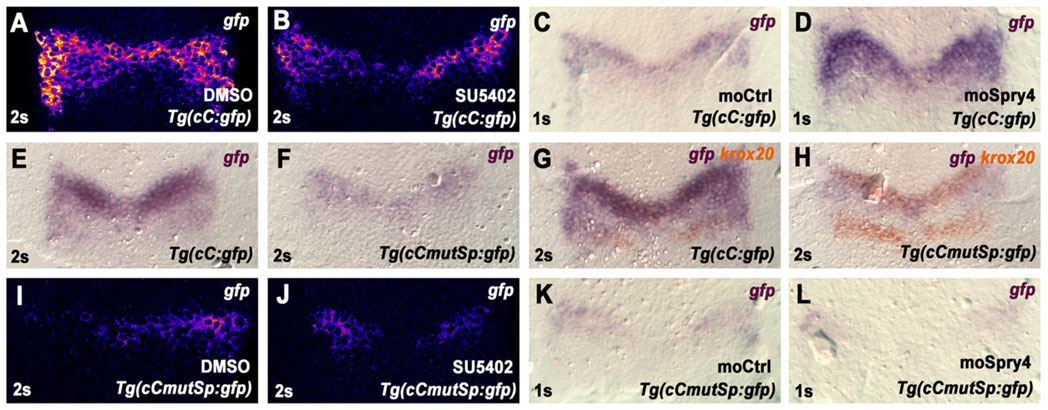
Regulation of enhancer C activity by Fgf signalling. (A-D) Tg(cC:gfp) embryos were treated with control DMSO carrier or SU5402 from the shield stage (A,B), or injected with a control morpholino (moCtrl) or a morpholino for spry4 (moSpry4), and analysed by ISH for gfp (three independent experiments). (E-H) Analysis of enhancer C activity in Tg(cC:gfp) and Tg(cCmutSp:gfp) embryos by single (E,F) or double (G,H) ISH for gfp (purple) and krox20 (orange) at 2s. (I-L) Tg(cCmutSp:gfp) embryos were treated with DMSO carrier or SU5402 from the shield stage (I,J), or injected with a control morpholino (K) or a morpholino for spry4 (S), and analysed by ISH for gfp (three independent experiments). In A,B,I,J, coloration reactions were performed with the Fast Red fluorescent compound to allow for quantification. ISHs were carried out in parallel on siblings under identical conditions.