
|
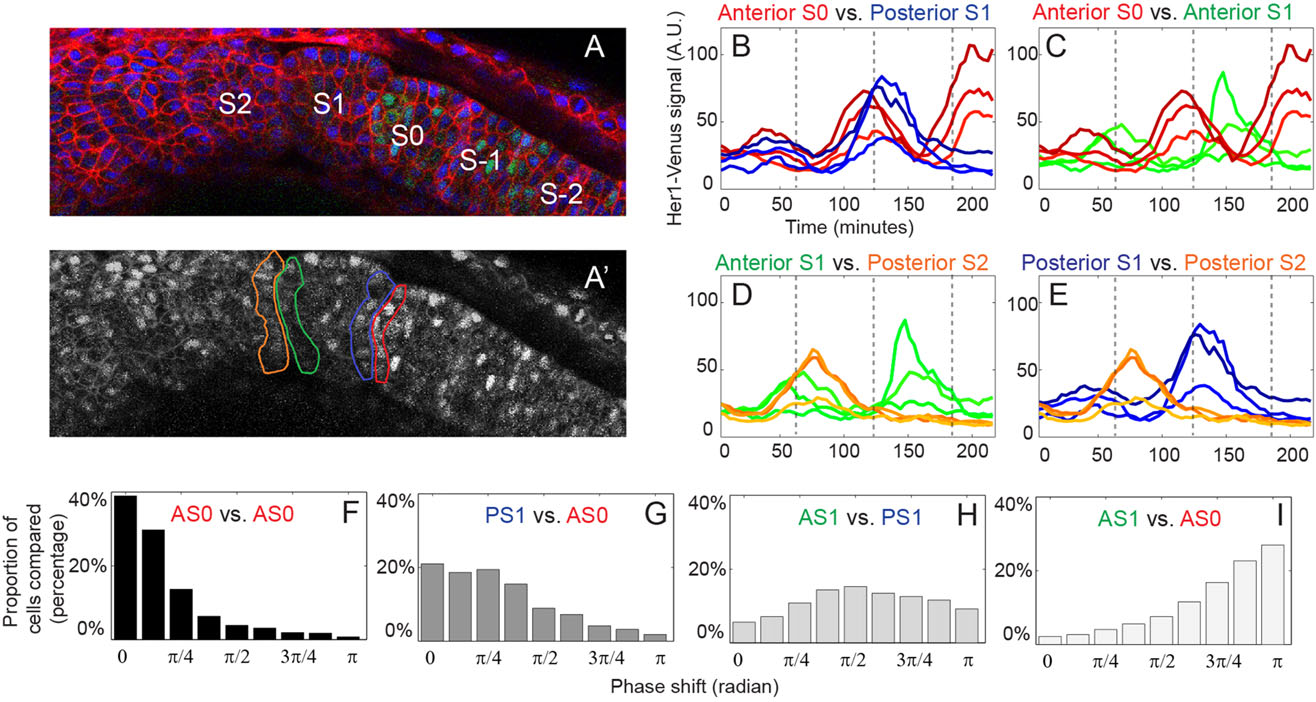
Fig. 2
Neighboring anterior PSM cells oscillate synchronously regardless of final somite position, while cells at a one-somite distance are in anti-phase. (A) Embryo at one timepoint (220min, in B-E) during a time lapse. Her1-Venus reporter fluorescence is indicated in green, with nuclei and membrane labeled with H2B-Cerulean and lyn-mCherry, respectively. (A2) Black and white image of the embryo in A. Colored outlines indicate the cohort of cells used to represent each boundary. S0 and S1 boundary cohorts (red/blue and orange/green, respectively) were identified by retrospectively tracing actual boundary cells. (B-E) Raw reporter fluorescence levels of three representative cells from each boundary cohort indicated in A′. To indicate the periodicity of somite formation, gray dashed lines indicate times at which morphological somite boundaries are forming in the imaged embryo. (F-I) Histograms of phase differences between boundary cell cohorts. Comparisons are made at every timepoint in the timelapse, and cells were identified based on their position at the end of the timelapse. Comparisons were made only if both cells were still oscillating. Phase differences are plotted between 0 (indicating cells are exactly in phase) and π (indicating opposite phase). Distance between the two compared populations increases from left to right. Average phase differences are 0.75 (F), 1.12 (G), 1.59 (H) and 2.17 (I), calculated from 15,003-35,740 pairwise comparisons in four embryos. See also supplementary material Figs S1-S3.