
|
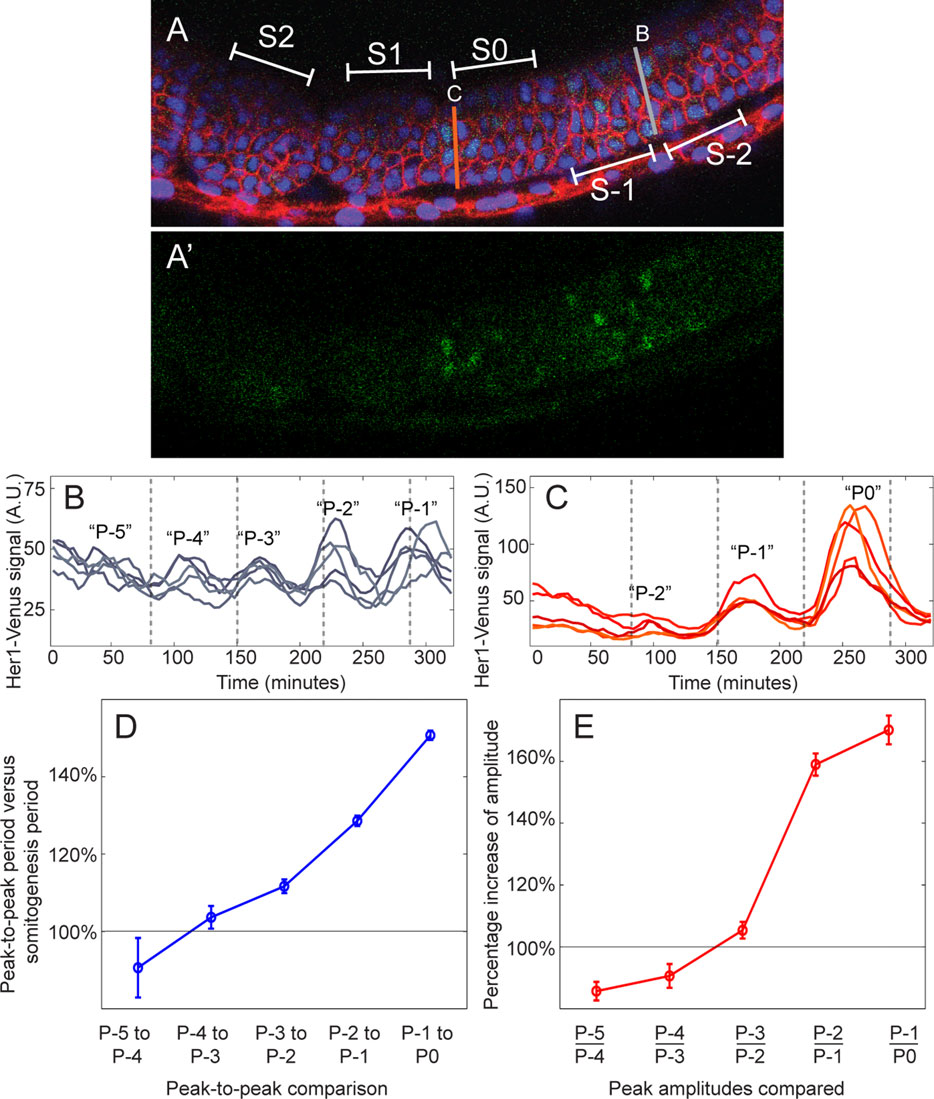
Fig. 1
Clock expression in anterior PSM cells gradually slows and increases in amplitude over the last two oscillations. (A) Representative embryo indicating somite designations in PSM and developing somites, with regions delineating formed somites (S1, S2), forming somite S0 and future somites (S-1, S-2) indicated. Gray and orange lines denote the approximate positions of cells at the last timepoint in B and C, respectively. Labeling of the nucleus and cell membrane is indicated by H2B-Cerulean (blue) and lyn-mCherry (red), respectively (A), and Her1-Venus reporter fluorescence is shown in green (A′). (B,C) Single-cell clock oscillations in a group of five neighbors in the posterior PSM (B) and the anterior PSM (C). Number of clock oscillations remaining is included in quotes above the expression peaks, with ‘P0’ indicating the last oscillation peak, ‘P-1’ indicating the second-to-last oscillation peak, and so on. The ‘P0’ oscillation peak occurs within S-1 or S0, depending on their final position in the forming somite (Delaune et al., 2012). Gray dashed lines indicate the times at which morphological somite boundaries are visibly formed. (D) The periodicity of clock expression relative to the periodicity of somitogenesis. Periodicity of oscillations was measured in four embryos (n=243 cells) based on the time between peaks of maximum expression. Somite periodicity was calculated based on the timing of morphological alignment of the boundary cells. (E) The change in clock expression amplitude measured in four embryos (n=243 cells), based on the ratio of amplitude change between two sequential oscillations. Data are mean±s.e.m.