
Image
|
Figure Caption
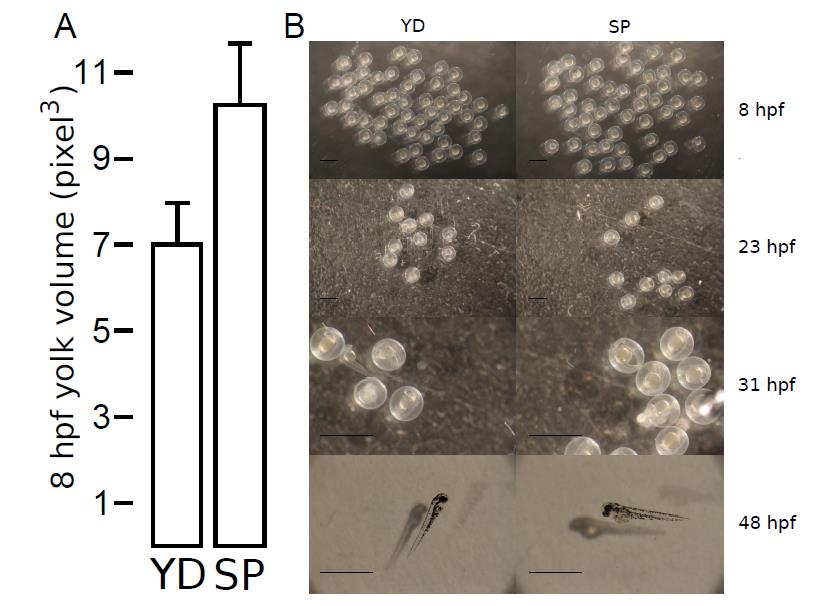
Fig. S1
Impression of YD and SP embryos at 4 time-points.
A) Mean sphere volume of embryos after YD and SP treatment. In this particular batch, on average 31 % of yolk was removed from YD embryos. Error bars denote standard deviations. B) Images of the total batch (8 hpf), and samples within this batch at 23, 31 and 48 hpf.
Acknowledgments
This image is the copyrighted work of the attributed author or publisher, and
ZFIN has permission only to display this image to its users.
Additional permissions should be obtained from the applicable author or publisher of the image.
Full text @ BMC Genomics