
|
Fig. S1
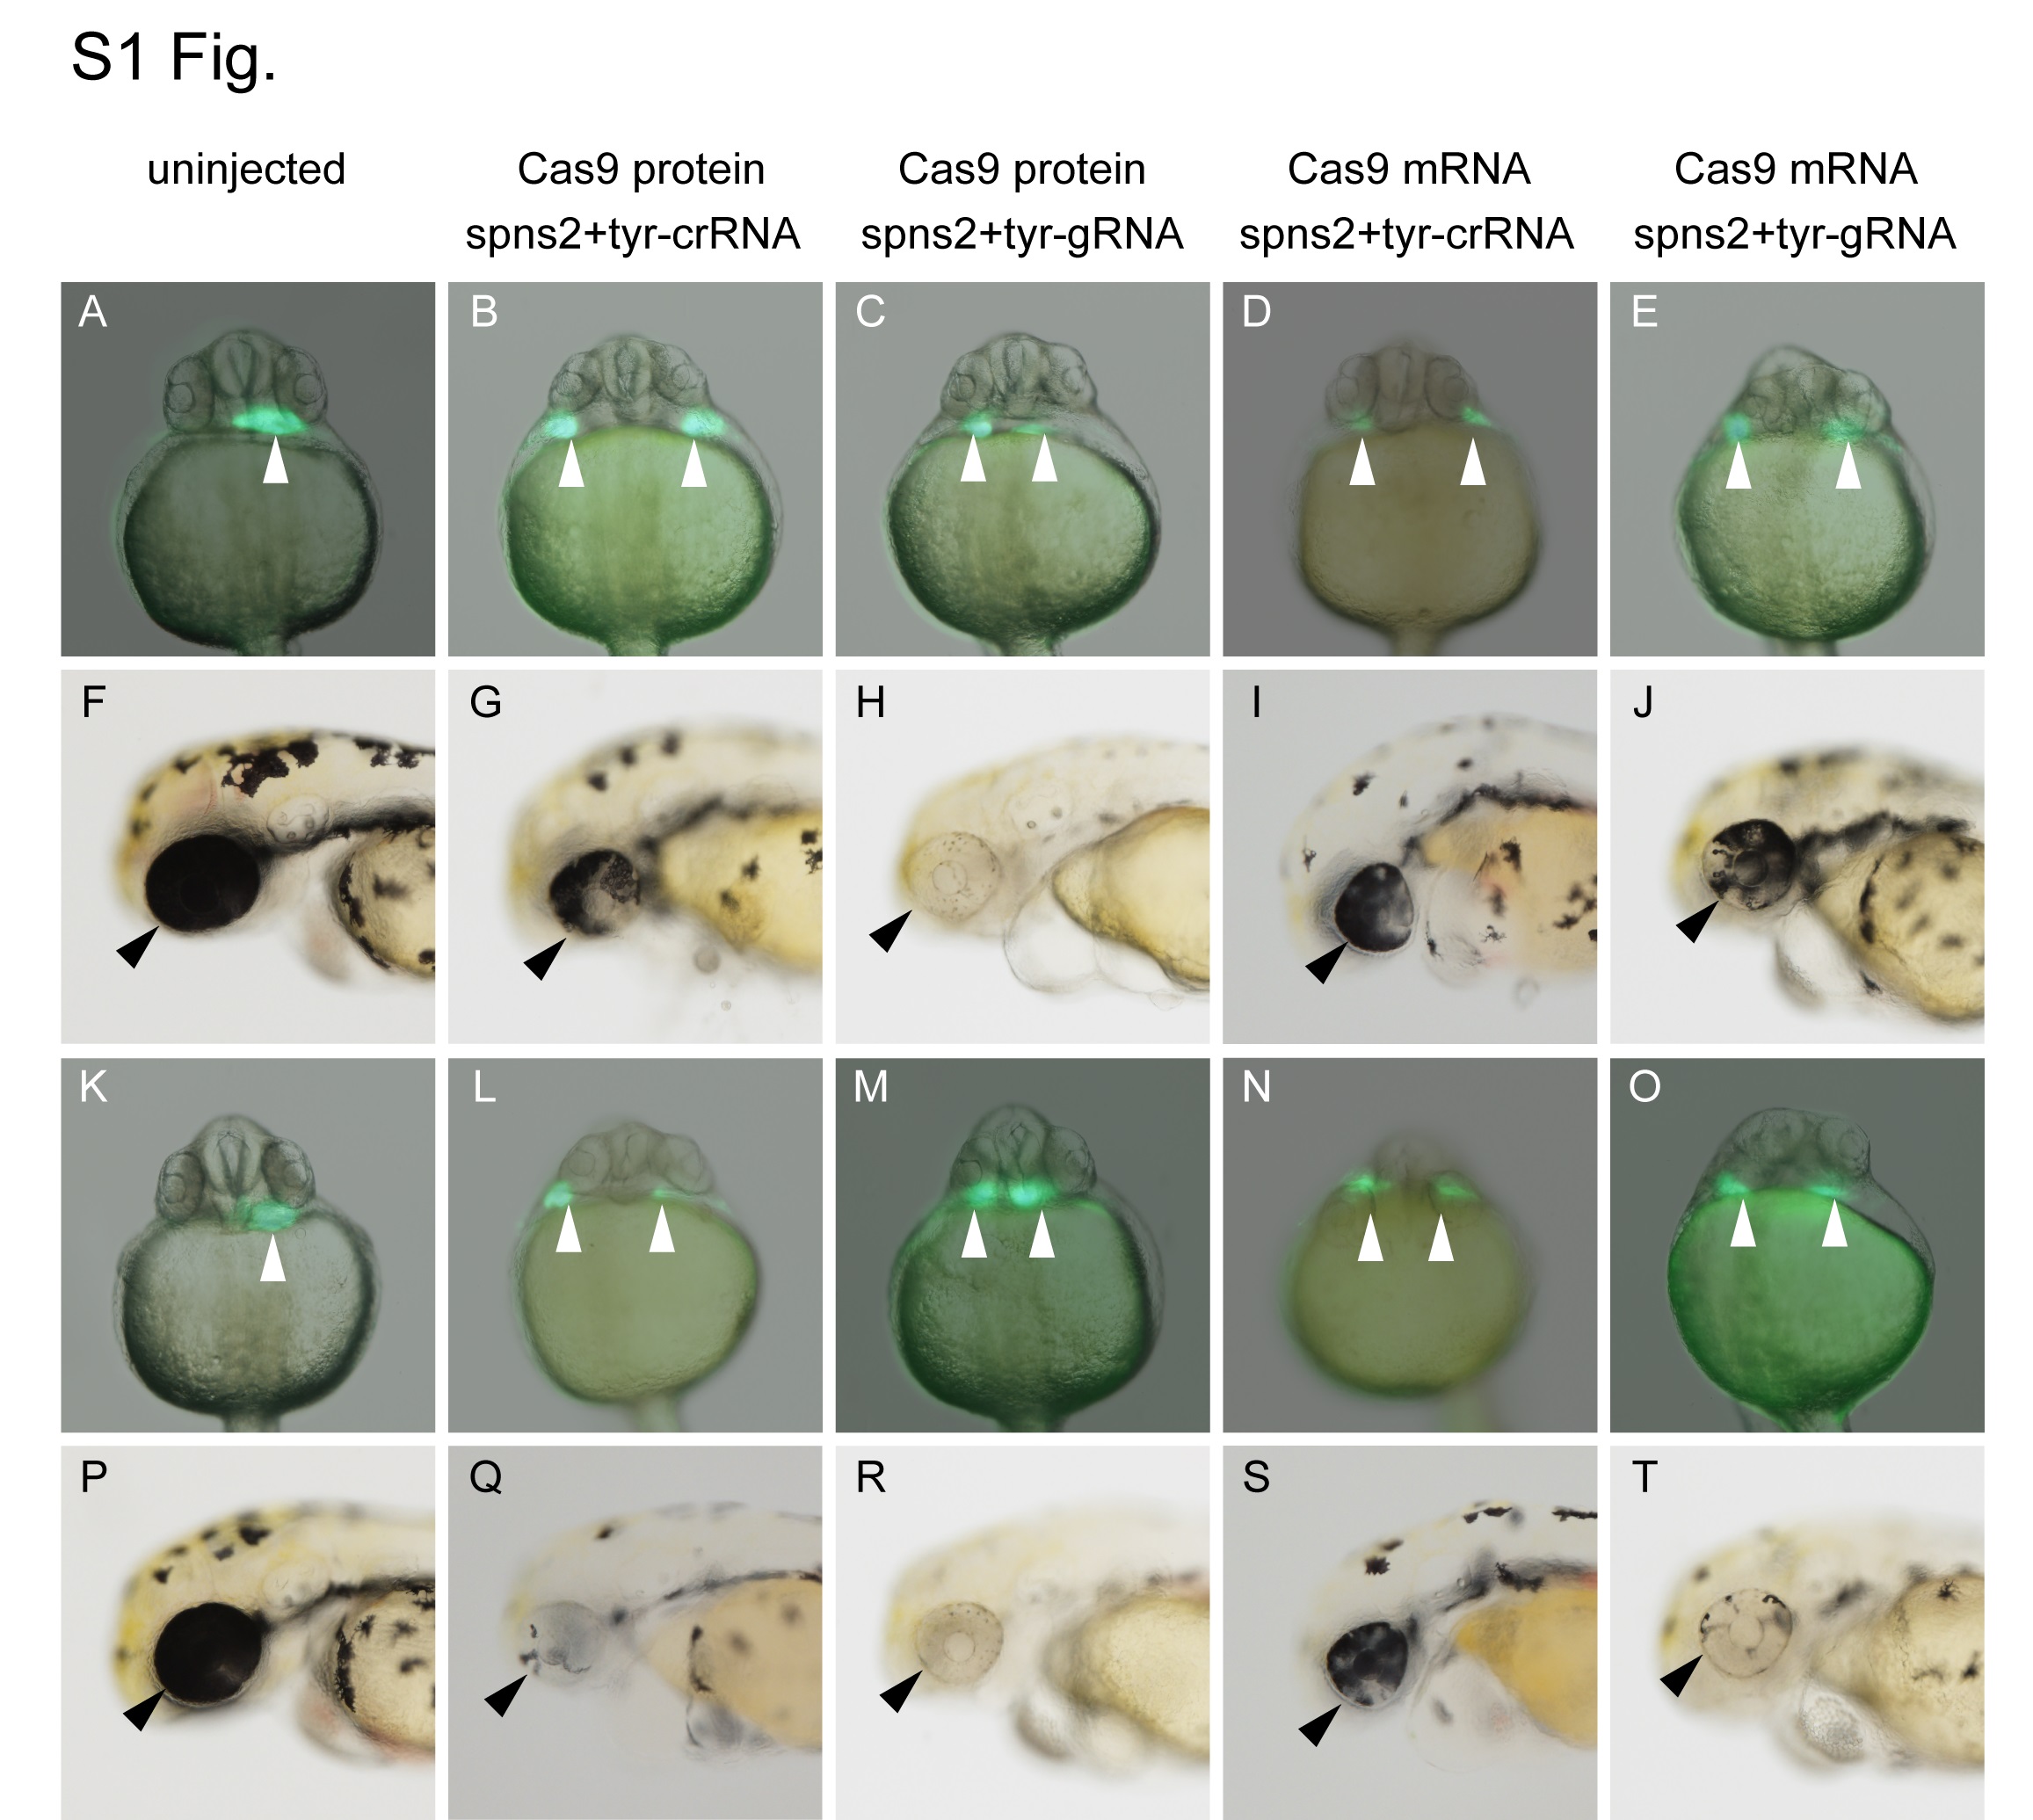
Phenotypic analysis of the embryos injected with two crRNAs, tracrRNA and Cas9 protein.
The injection conditions used in S1 Fig were the same as those used in Fig 1. (A, F, K, P) uninjected embryos. (B, G, L, Q) Tg(cmlc2:EGFP)-derived embryos injected with spns2-crRNA1, tyr-crRNA, tracrRNA and Cas9 protein. (C, H, M, R) Tg(cmlc2:EGFP)-derived embryos injected with spns2-gRNA1, tyr-gRNA and Cas9 protein. (D, I, N, S) Tg(cmlc2:EGFP)-derived embryos injected with spns2-crRNA1, tyr-crRNA, tracrRNA and Cas9 mRNA. (E, J, O, T) Tg(cmlc2:EGFP)-derived embryos injected with spns2-gRNA1, tyr-gRNA and Cas9 mRNA. The phenotypic results between the samples in Fig 1 and S1 Fig are essentially similar. White and black arrowheads indicate the position of the developing heart and the position of the eye, respectively. The embryos in (A), (B), (C), (D), (E), (K), (L), (M), (N) and (O) correspond to the embryos in (F), (G), (H), (I), (J), (P), (Q), (R), (S) and (T), respectively. (A-E, K-O) Ventral view with anterior at the top at 1 dpf. (F-J, P-T) Lateral view with anterior to the left and dorsal at the top at 2 dpf.