
Fig. 1
- ID
- ZDB-IMAGE-150710-20
- Publication
- Wang et al., 2015 - Fate mapping of ptf1a-expressing cells during pancreatic organogenesis and regeneration in zebrafish
- All Figures
- Figures for Wang et al., 2015
|
Fig. 1
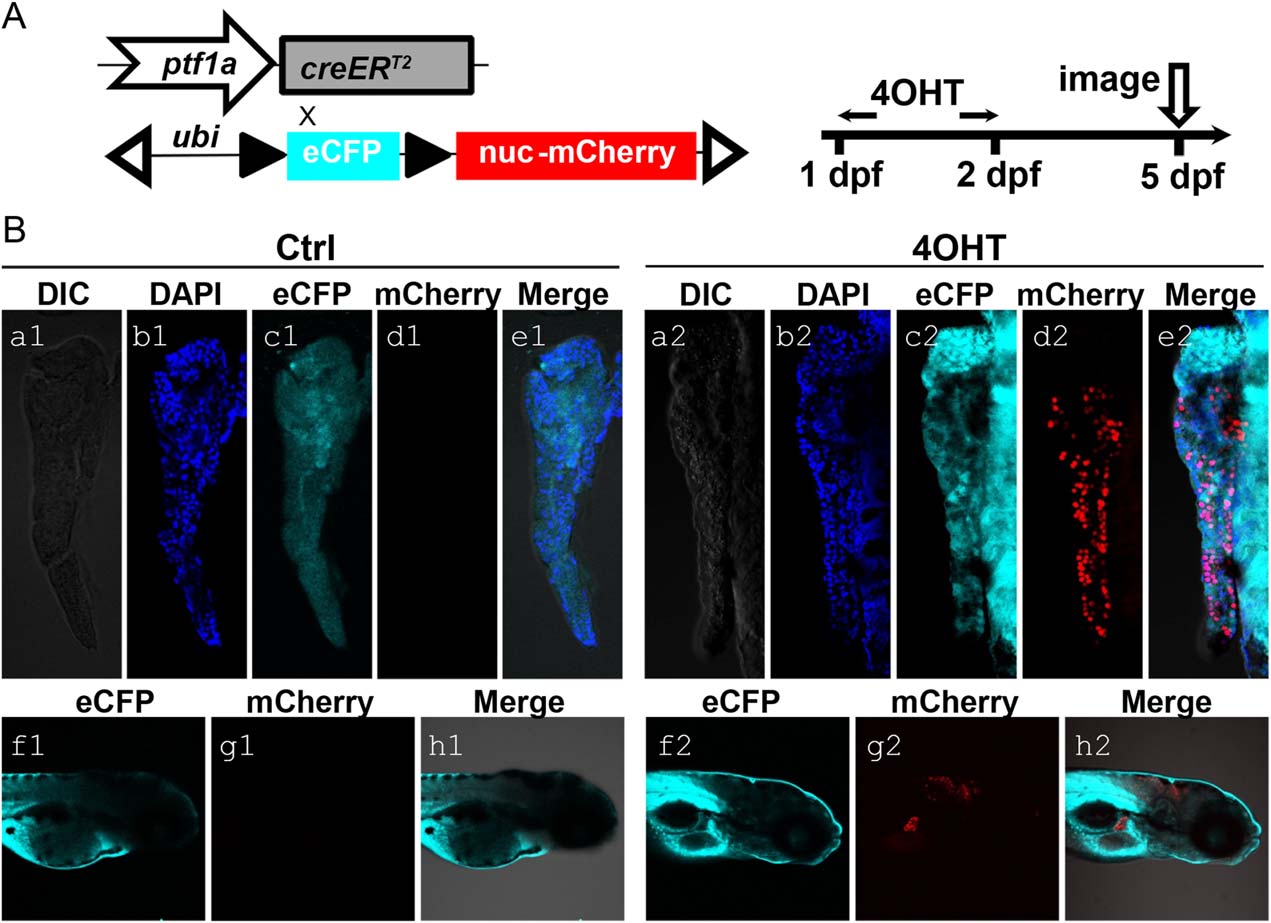
Generation of the ptf1a lineage tracing system and its initial characterization. A: Schematic diagram of ptf1a:creERT2 driver and responder ubi:loxP-CFP-loxP-nuc-mCherry. Double transgenic fish larvae were treated with 5 µM 4-OHT in E3 medium at 1 dpf for 24 hr and then fixed for imaging at 5 dpf. These larvae were raised along with untreated controls. B: At 5 dpf, no pancreatic and hindbrain nuclear-mCherry signals were detected in control larvae (a1–e1, f1–h1). 4-OHT-treated larvae showed nuclear-mCherry signal (red) in exocrine pancreas (a2–e2) and hindbrain (f2–h2), indicating ptf1a-dependent Cre activity. CFP signal (cyan) could be detected ubiquitously (c1, f1, c2, f2). DAPI (blue) stains for nuclei (b1, b2).