
Fig. 2
- ID
- ZDB-IMAGE-150710-15
- Genes
- Publication
- Otsuna et al., 2015 - High-resolution analysis of CNS expression patterns in zebrafish Gal4 enhancer-trap lines
- All Figures
- Figures for Otsuna et al., 2015
|
Fig. 2
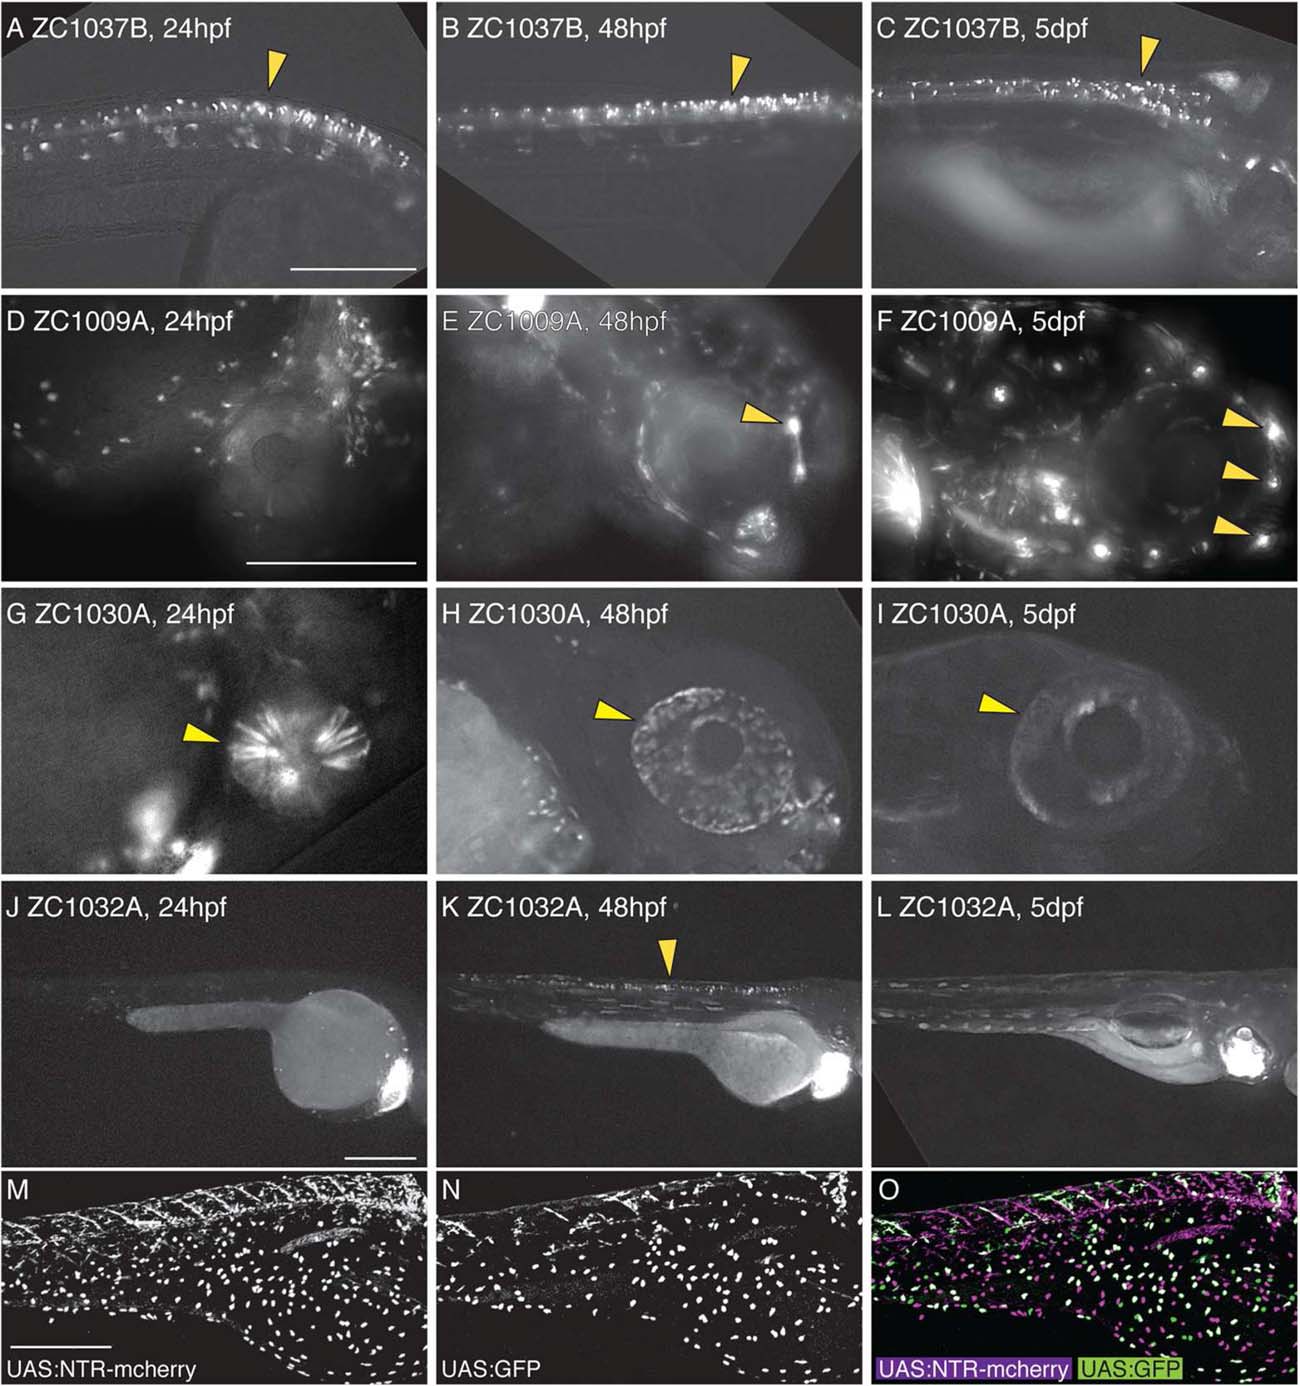
Dynamic temporal expression patterns in enhancer trap screen. Compound images taken at 24 hpf (A,D,G,J), 48 hpf (B,E,H,K), or 5 dpf (C,F,I,L) show examples of neural expression that is maintained at all ages (A–C), is activated over time (D–F), is inactivated over time (G–I), or is only present at one timepoint (J–L). Arrowheads mark spinal neurons (A–C, K), lateral line neuromasts (E,F), and the eye (G–I). UAS reporters exhibit transgene-specific variegation, leading to partially overlapping but distinct expression patterns in a single animal (M–O). All images are lateral views. Scale bar = 250 µm for A–C; 250 µm in D–I, 250 µm in J–L; 300 µm in M–O.