
Fig. 6
- ID
- ZDB-IMAGE-150612-6
- Genes
- Publication
- Hall et al., 2013 - Immunoresponsive Gene 1 Augments Bactericidal Activity of Macrophage-Lineage Cells by Regulating β-Oxidation-Dependent Mitochondrial ROS Production
- All Figures
- Figures for Hall et al., 2013
|
Fig. 6
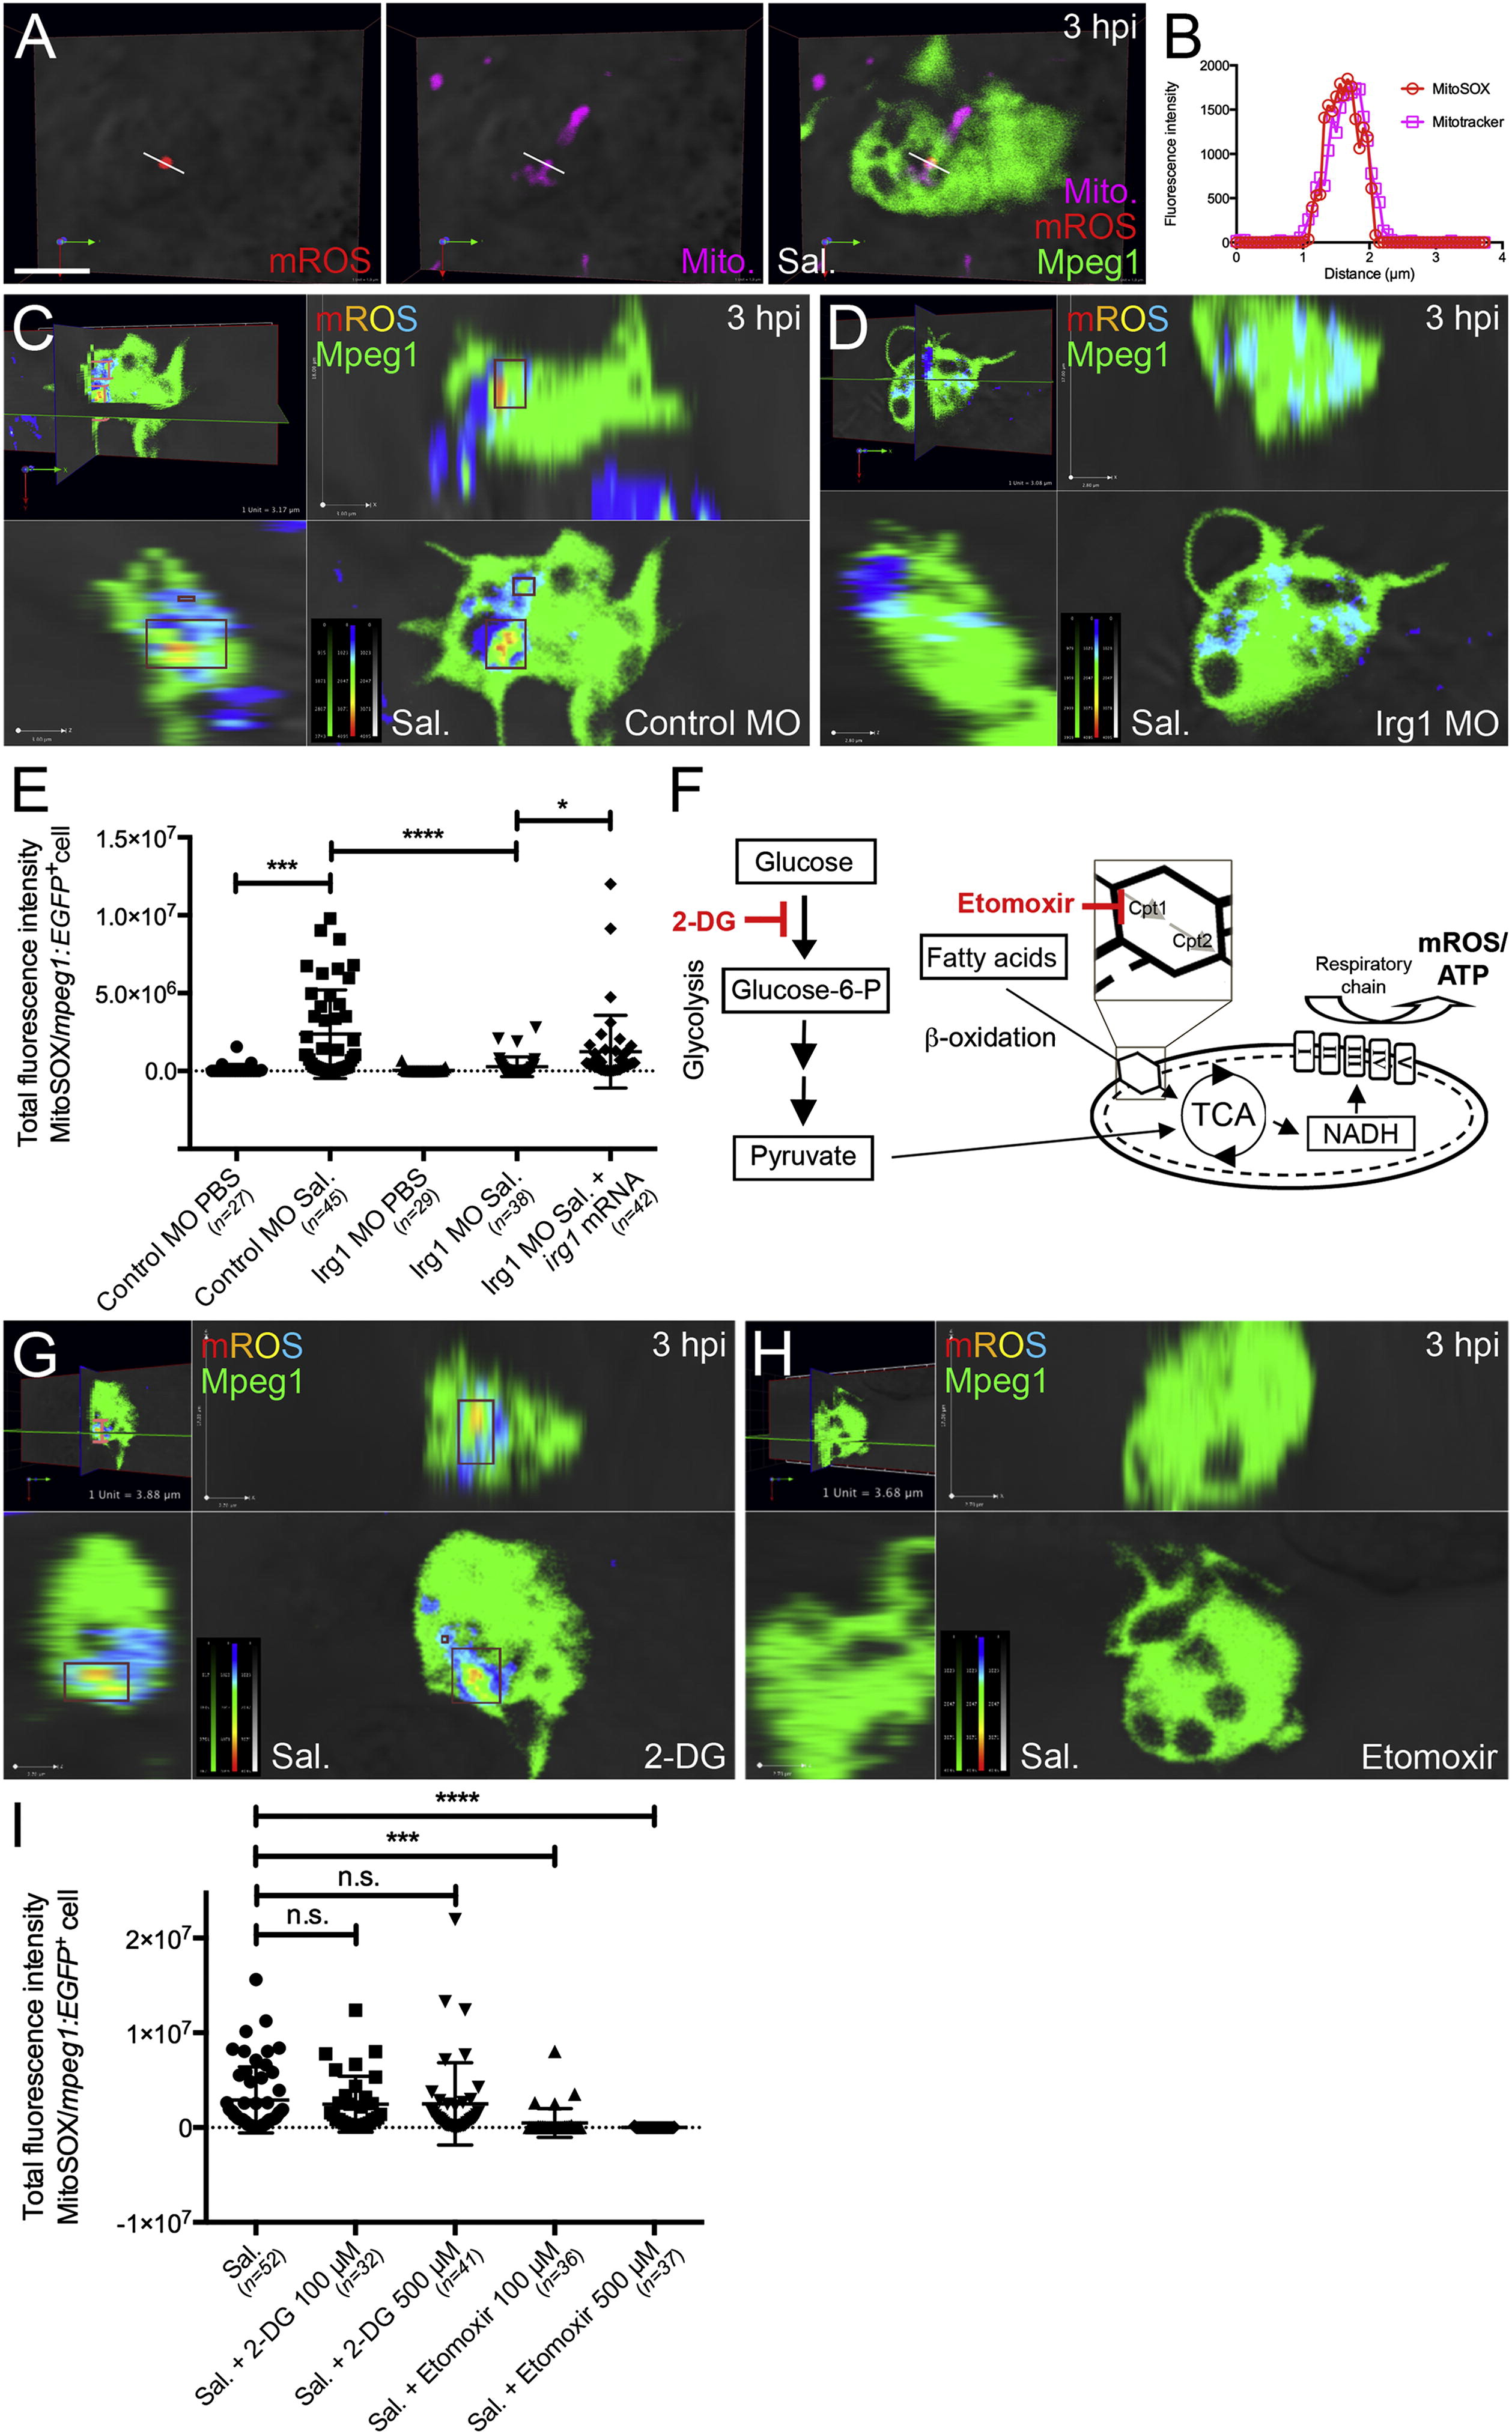
mROS Production within Macrophage-Lineage Cells Is Dependent on Irg1 and Fatty Acid β-Oxidation
(A) Live confocal imaging of mROS production by macrophage-lineage cells within the midbrain/hindbrain region of Tg(mpeg1:EGFP) larvae at 3 hpi (following injection of Salmonella (Sal.), MitoSOX, and MitoTracker mitochondria-marking probes).
(B) Line intensity profiles for MitoSOX and MitoTracker (for line shown in A) demonstrating overlapping signals and specificity of MitoSOX to the mitochondria of macrophage-lineage cells.
(C and D) Live confocal imaging of mROS production by macrophage-lineage cells within the midbrain/hindbrain region of control MO-injected and Irg1-depleted Tg(mpeg1:EGFP) larvae at 3 hpi, respectively, following Salmonella and MitoSOX injection. MitoSOX fluorescence intensity is displayed as a colormap, with warmer colors representing higher signal intensities.
(E) Quantification of mROS production by macrophage-lineage cells (measured as total fluorescence intensities of MitoSOX within individual mpeg1+ cells), as marked in (C), within control MO-injected and Irg1-depleted Tg(mpeg1:EGFP) larvae at 3 hpi, following PBS or Salmonella (Sal.) injection (mean ± SD). For the rescue experiment, 300 pg irg1 mRNA was coinjected with Irg1-targeting MOs. Five to ten larvae were sampled per treatment.
(F) Schematic illustrating glucose and fatty acids as alternate energy sources for mitochondrial respiration and associated mROS production. Points of activity for 2-DG (glycolysis inhibitor) and the β-oxidation inhibitor etomoxir (specific for Cpt1) are marked.
(G and H) Live confocal imaging of mROS production by macrophage-lineage cells within the midbrain/hindbrain region of Tg(mpeg1:EGFP) larvae at 3 hpi, following Salmonella (Sal.)/MitoSOX injection supplemented with 500 µM of 2-DG and etomoxir, respectively.
(I) Quantification of mROS production by macrophage-lineage cells (as measured in G and H) following indicated treatments (mean ± SD). Five to ten larvae were sampled per treatment. Scale bar, 5 µm in (A). Abbreviations: n.s., not significant; p < 0.05; p < 0.001; p < 0.0001. See also Figure S6.
Reprinted from Cell Metabolism, 18(2), Hall, C.J., Boyle, R.H., Astin, J.W., Flores, M.V., Oehlers, S.H., Sanderson, L.E., Ellett, F., Lieschke, G.J., Crosier, K.E., and Crosier, P.S., Immunoresponsive Gene 1 Augments Bactericidal Activity of Macrophage-Lineage Cells by Regulating β-Oxidation-Dependent Mitochondrial ROS Production, 265-278, Copyright (2013) with permission from Elsevier. Full text @ Cell Metab.