
|
Fig. 7
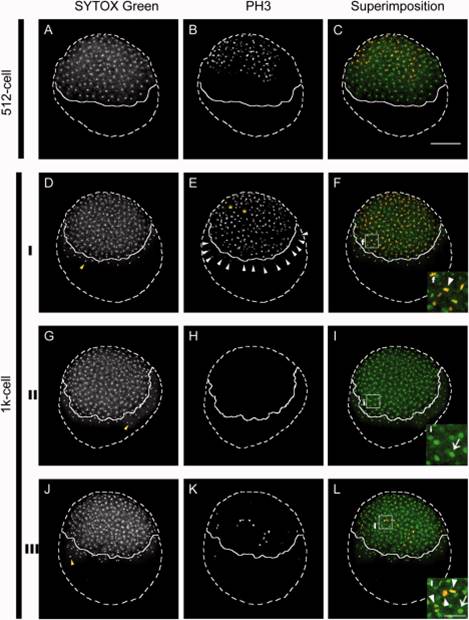
Proliferation patterns in 512- (A–C) and 1k-cell stage zebrafish embryos (D–L). The punctuated line shows the contour of the embryos, and continuous lines indicate the margin between blastoderm and the yolk cell. I: A 1k-cell embryo showing the characteristic yolk syncytial layer (YSL) nuclei (yellow arrowhead in D), with all their nuclei positive for the PH3 marker (arrowheads in E). Asterisks in E indicate clusters of nuclei negative for the PH3 marker. Arrowhead in F insert shows a metaphase cell II: A 1k-cell embryo showing the blastoderm and YSL nuclei (yellow arrowhead in G) negative for the PH3 marker (H). Arrowhead in I insert shows an interphase cell. III: A 1k-cell embryo showing only one YSL nuclei (yellow arrowhead in J) positive for the PH3 marker (K) and scattered blastoderm cells in mitosis. Arrowhead in I insert shows an interphase cell. Arrowheads in L insert shows cell nuclei at different stages of mitosis and the arrow shows an interphase nuclei. Lateral views are shown. Nuclei are in green, PH3 marker in red. Scale bar 200 µm in C; 50 µm in L.