
|
Fig. 2
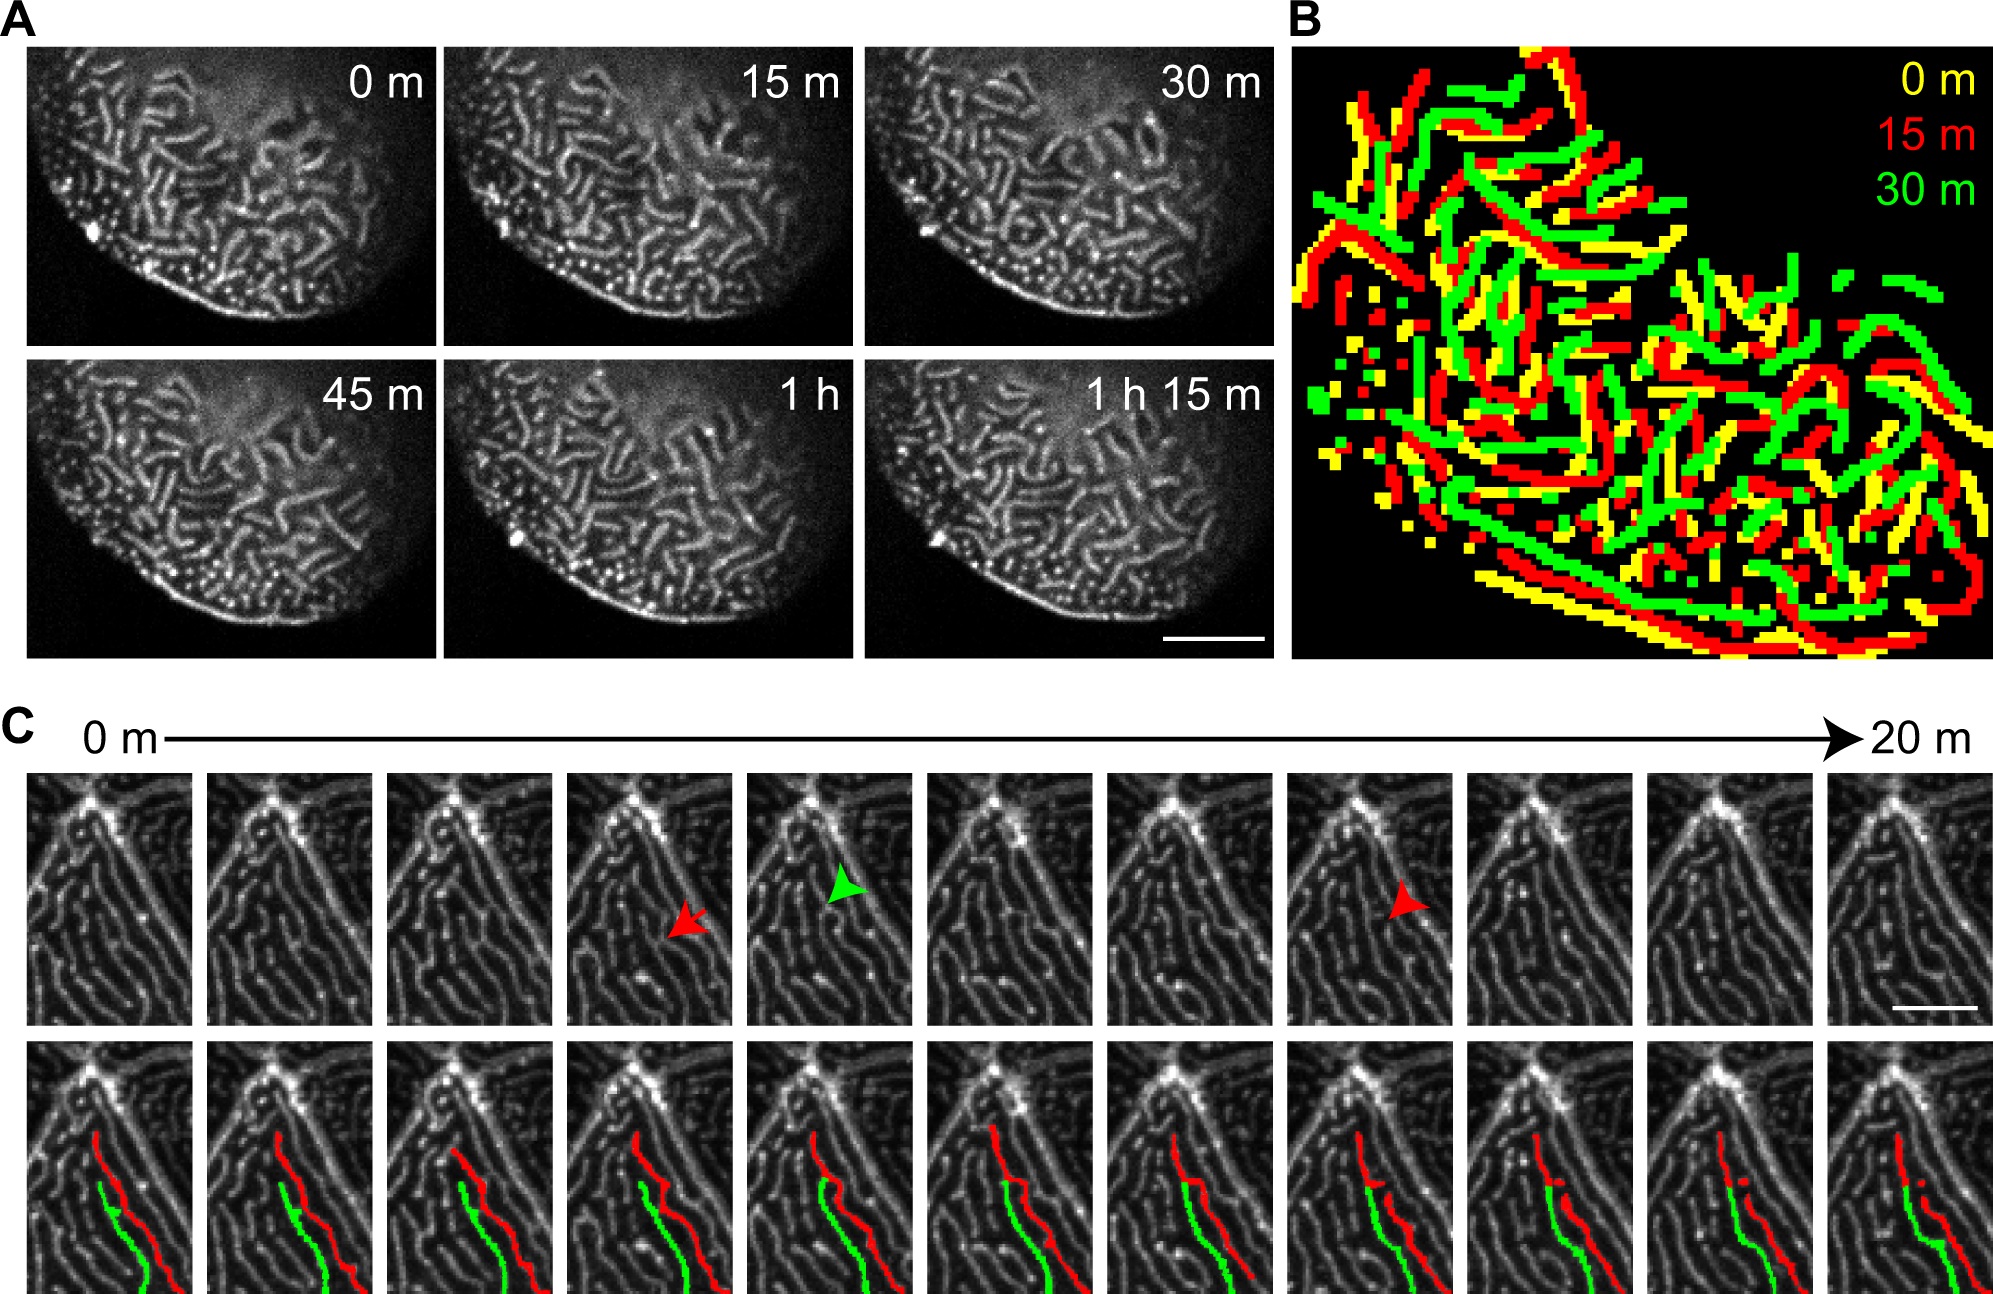
Microridges are dynamic in vivo.
GFP-UtrCH was transiently expressed in epithelial cells in zebrafish larvae at 2.5 dpf. (A) Maximum intensity projection of confocal images showing changes in microridge pattern over time (S2 Movie). Scale bar, 10 µm. (B) Overlay of microridge pattern in the same cell at time points indicated. Microridges are color-coated to indicate patterns from different time points. (C) Time-lapse maximum intensity projection images showing how microridge patterns rapidly change by bending (red arrow), breaking (red arrowhead) and connecting (green arrowhead) (S3 Movie). (Top panel) Images acquired every 2 minutes are shown. (Bottom panel) Duplication of the top panel with two adjacent microridges labeled with pseudo-color to aid in the visualization of microridge dynamics. Scale bar, 5 µm.