
Fig. 2
- ID
- ZDB-IMAGE-150601-111
- Genes
- Antibodies
- Publication
- Sun et al., 2015 - Myc-Induced Liver Tumors in Transgenic Zebrafish Can Regress in tp53 Null Mutation
- All Figures
- Figures for Sun et al., 2015
|
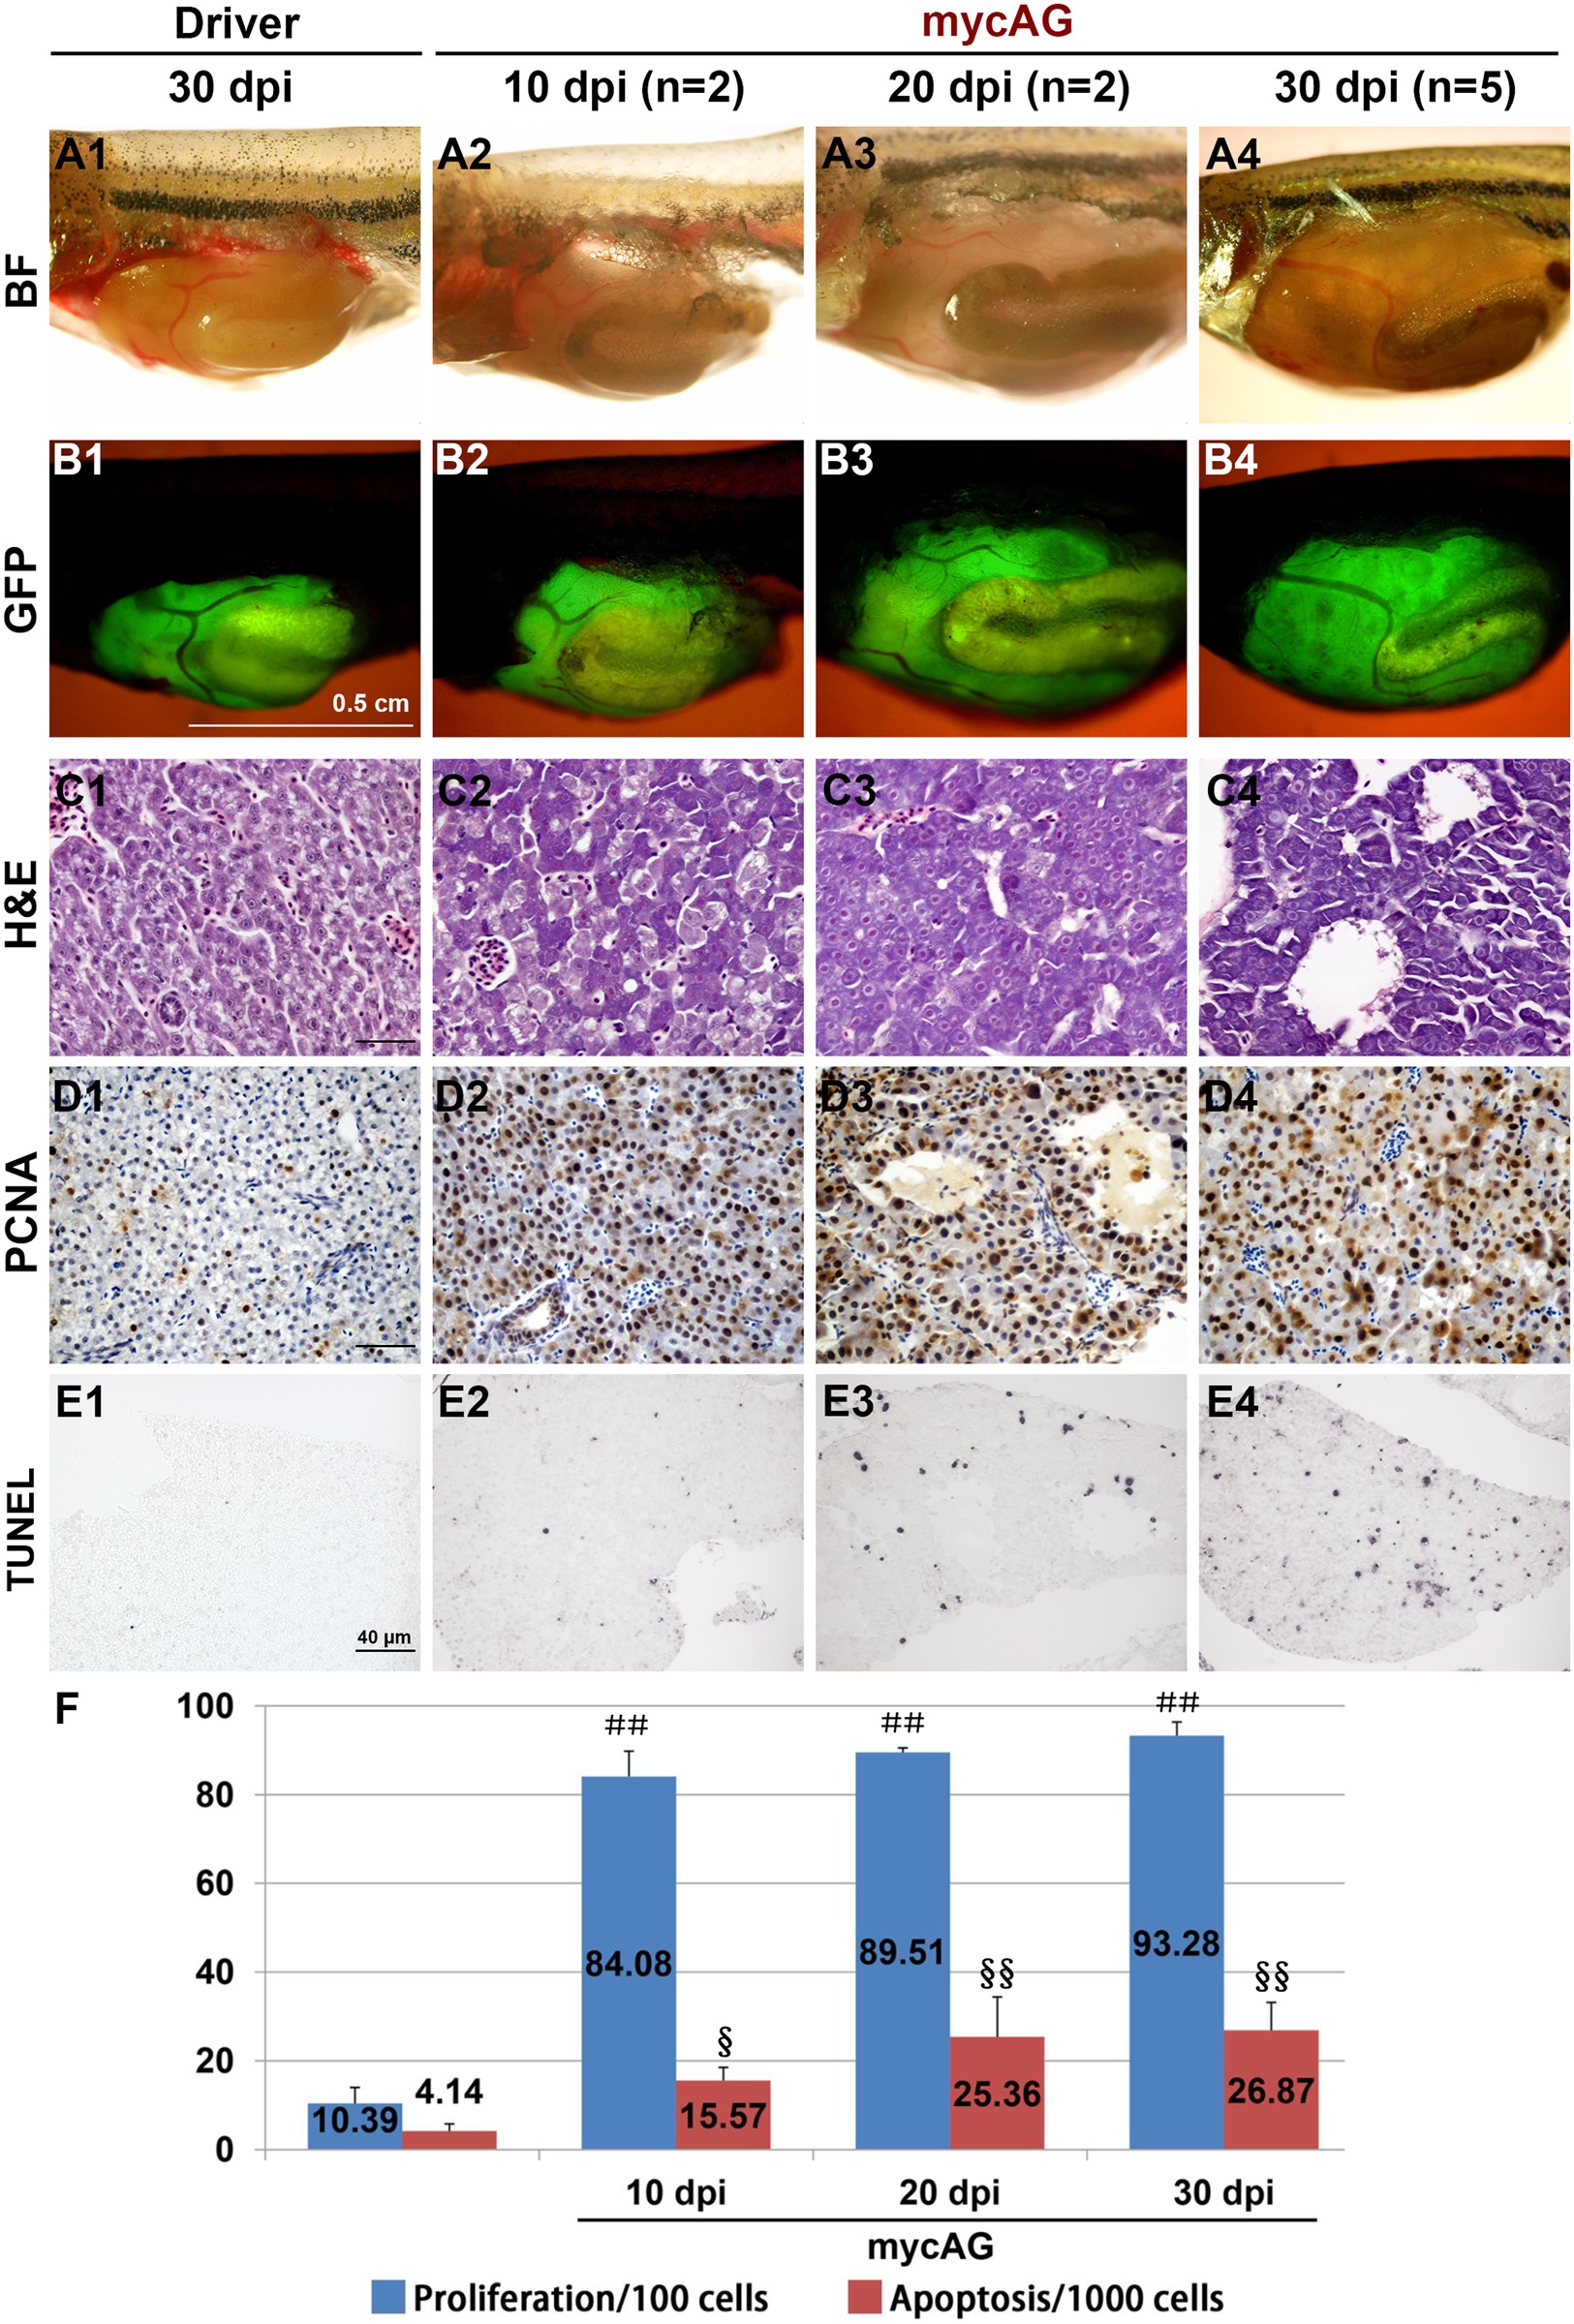
Fig. 2 Rapid induction of live tumors by induced mycAG expression.
MycAG fish were induced with 2 µM mifepristone from 1 mpf and sampled at 10, 20 and 30 dpi for gross observation as indicated in the figure. (A1-A4) Gross observation of liver tumors after removal of abdominal wall. (B1-B4) The same views as those in (A1-A4) for observation of GFP expression that illustrate the shape of livers. (C1-C4) H&E staining to show cellular alteration in the fish liver. (D1-D4) PCNA staining by immunocytochemistry to show cell proliferation. (E1-E4) TUNEL assay to reveal the apoptosis in the liver. (F) Quantitative analyses of cell proliferation and apoptosis. indicates highly significant difference (P<0.01) in proliferation when compared that in the Driver control at 30 dpi; § and §§, indicate significant (P<0.05) and highly significant (P<0.01) difference respectively in apoptosis when compared to that in the Driver control at 30 dpi.