
|
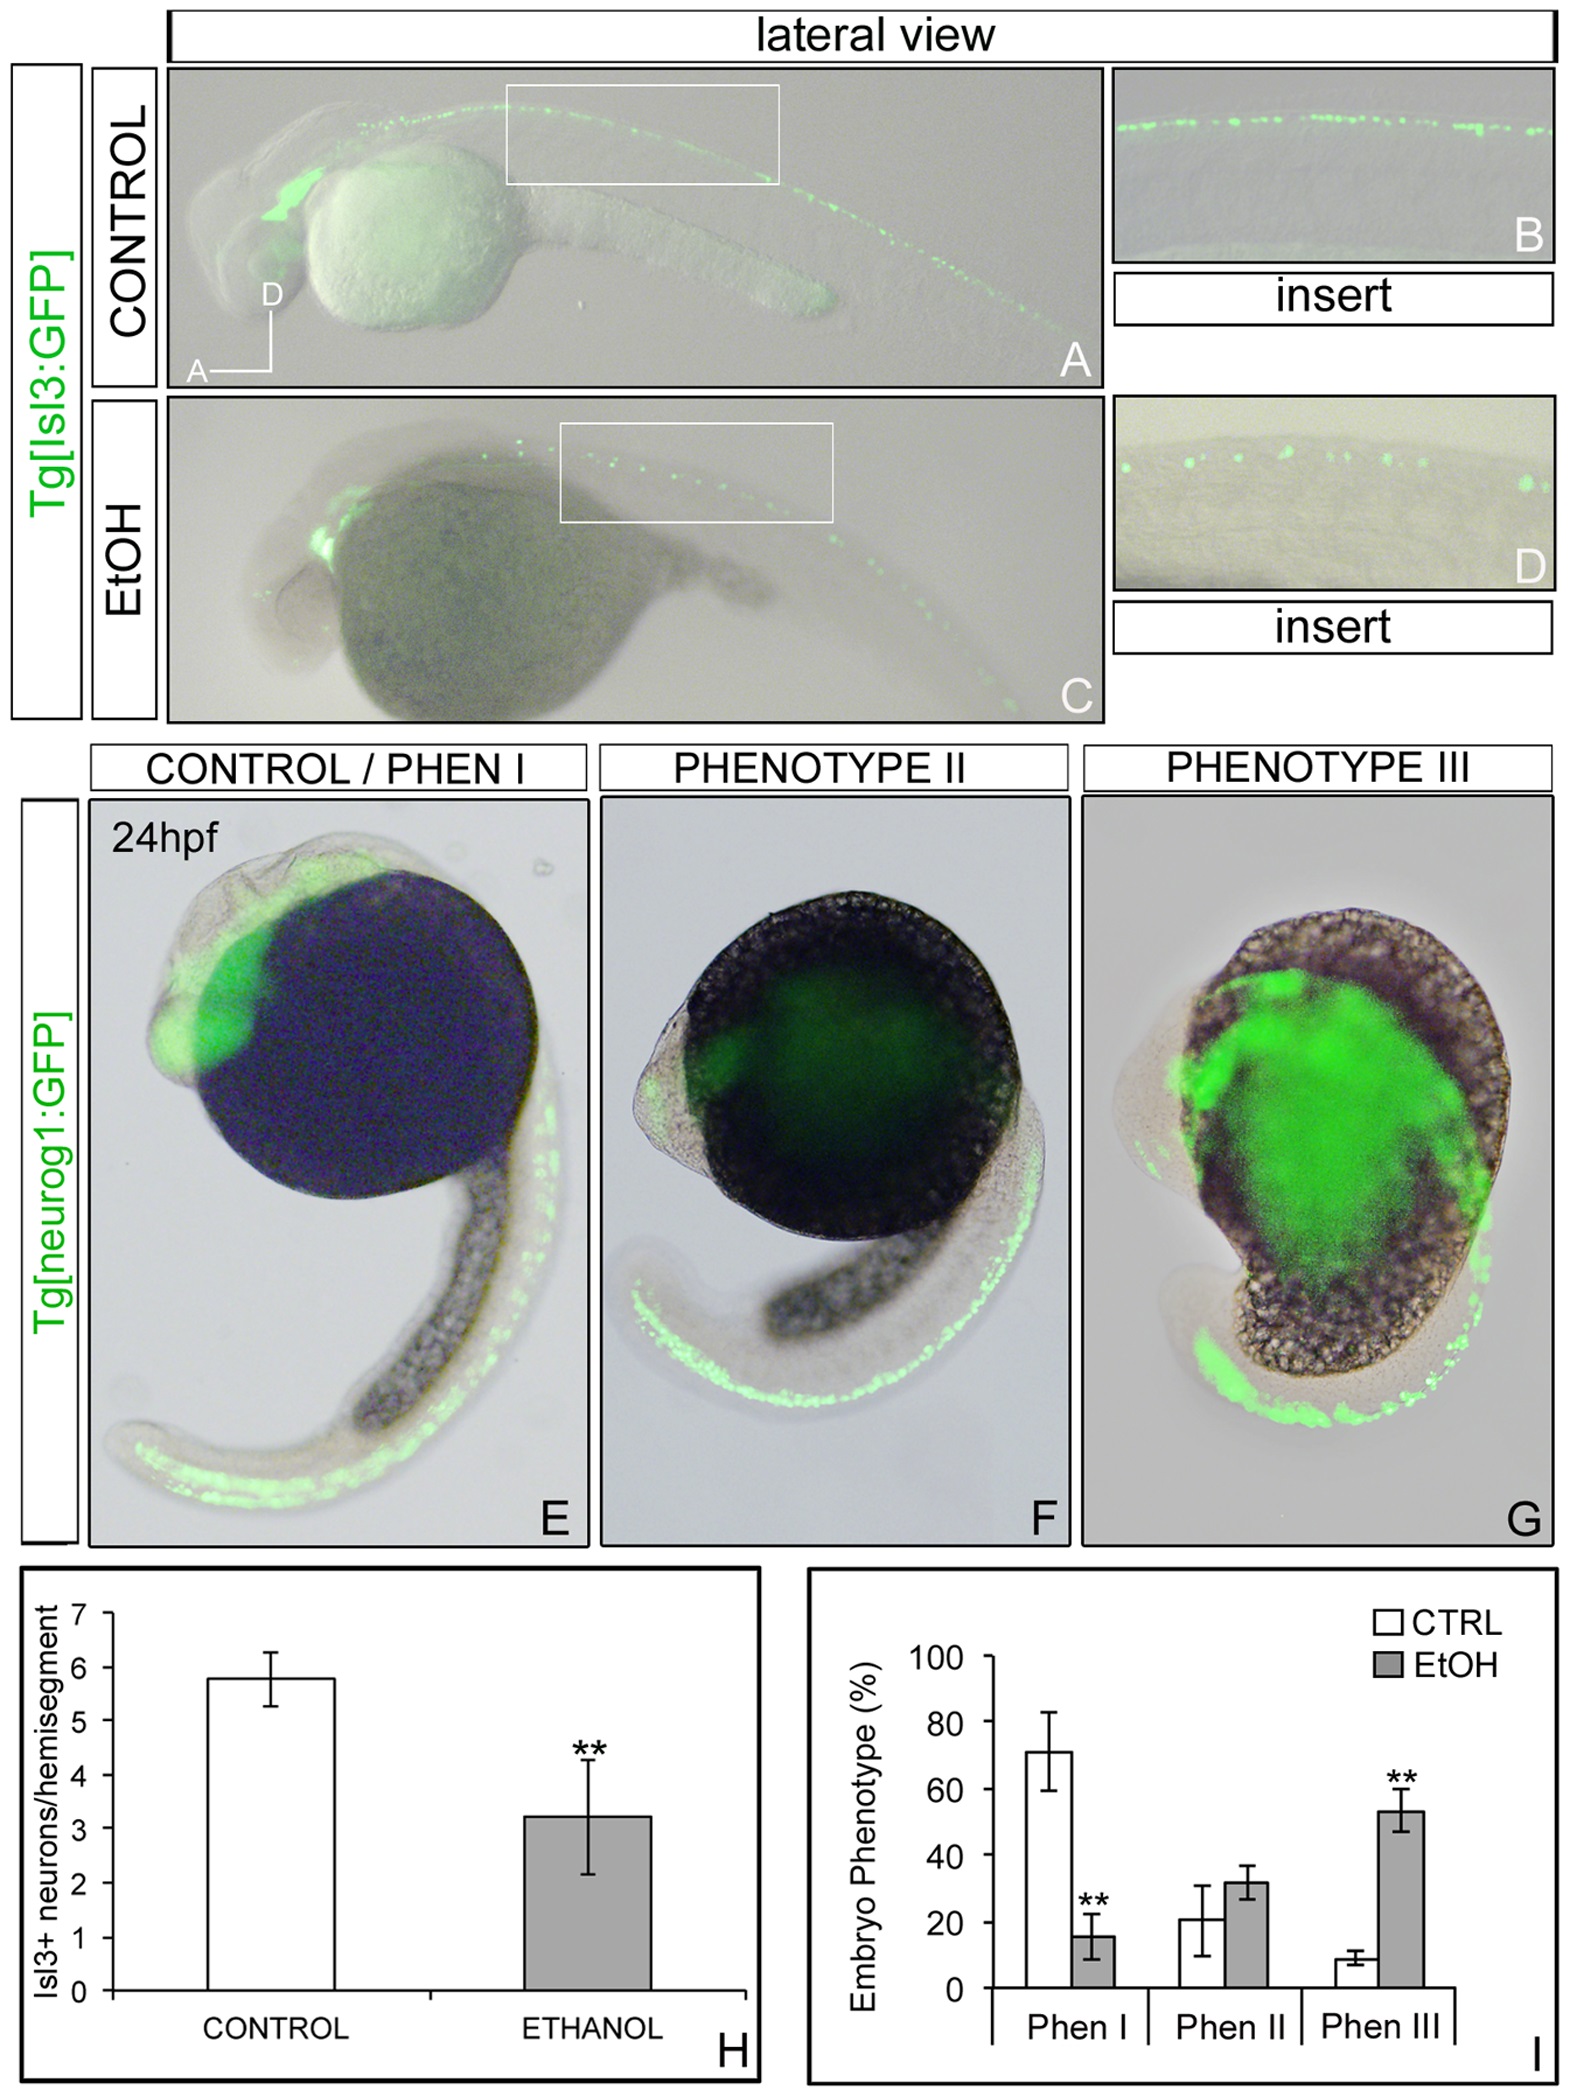
Fig. 4 Effects of ethanol in specific neuronal populations
Analysis of Tg[Isl3:GFP] non-exposed embryos (A-B) and exposed to ethanol (C-D) expressing GFP in the primary sensory neurons. (E-G) Tg[neurog1:GFP] embryos treated with ethanol display a graded phenotype: (E) Phenotype I embryos showed a normal development with high levels of GFP along the CNS, (F) Phenotype II embryos showed a delay in their development but displayed normal levels of GFP, and (G) Phenotype III, which has a very short body axis and GFP levels not grossly affected. (H) Quantification of GFP-positive sensory neurons in specific hemisegments. Note the decrease in the number of Isl3:GFP neurons per hemisegment in the ethanol-treated embryos. (I) Quantification of the penetrance of the phenotype in Tg[neurog1:GFP] embryos. ** p<0.005 vs. control group.