
Image
|
Figure Caption
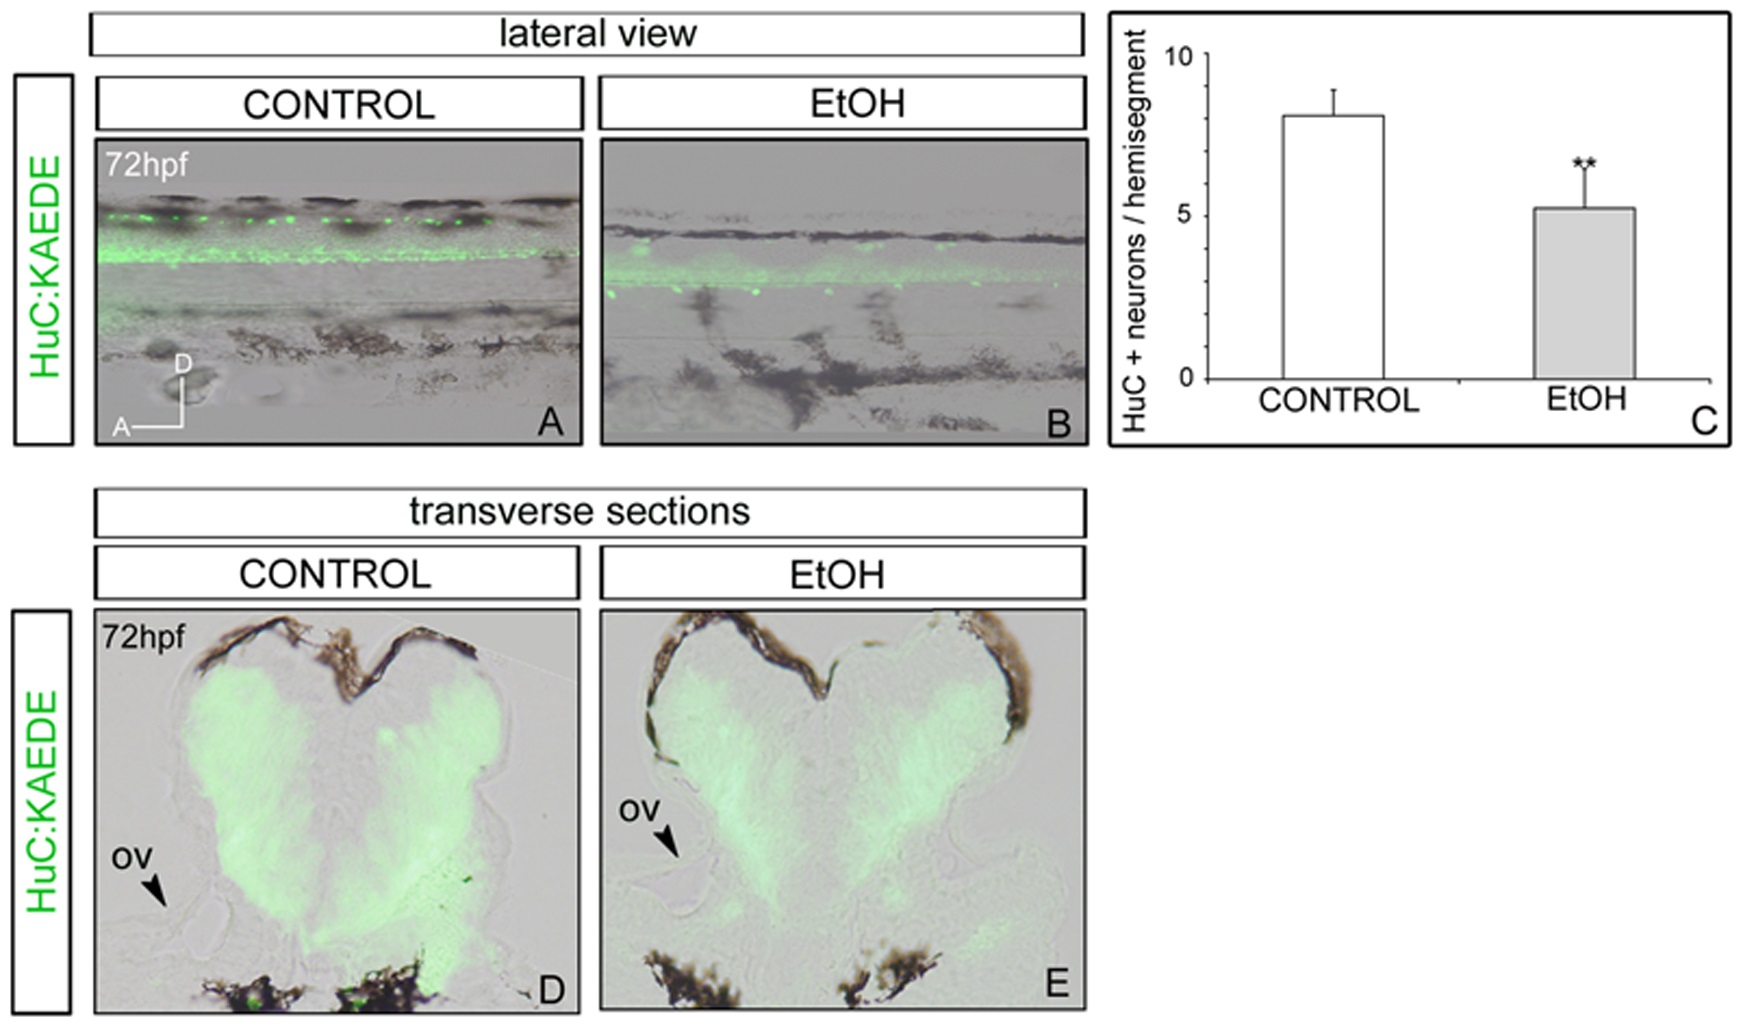
Fig. 2 Analysis of Tg[HuC:KAEDE] embryos after ethanol exposure.
Control (A,D), or ethanol-treated embryos (B,E) were analysed for neuronal differentiation. (C) Quantification of KAEDE-positive differentiated neurons per hemisegments. Note that EtOH-treated embryos have less differentiated neurons in the spinal cord. (A-B) Lateral views of 72hpf embryos with anterior to the left. (D-E) Transverse sections at the level of the hindbrain. ov; otic vesicle. ** p<0.005 vs. control group.
Figure Data
Acknowledgments
This image is the copyrighted work of the attributed author or publisher, and
ZFIN has permission only to display this image to its users.
Additional permissions should be obtained from the applicable author or publisher of the image.
Full text @ PLoS One