
|
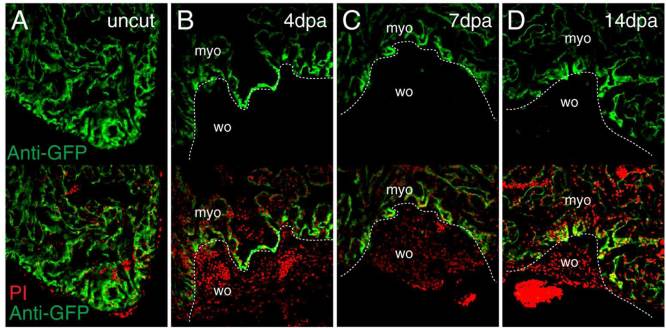
Fig. 3
GFP expression patterns of the medaka fli1-GFP transgenic line after ventricular resection. A–D: Fluorescent images of hearts of the fli1-GFP transgenic line: uncut heart (A) and resected hearts at 4 dpa (B), 7 dpa (C), and 14 dpa (D). Infiltration of the wound site by GFP-positive cells was not observed by 14 dpa (D). For observing GFP signals, we used anti-GFP antibodies for detecting stronger signals, compared with intact signals from the transgenic line. PI signals show nuclei. PI merge panels are shown to clarify the injury area. The panel with GFP signals without PI shows all GFP signals including weak GFP signals that may be hidden by PI signals in the wound area. The dashed line indicates the approximate injury border. myo, myocardium; wo, wound area. PI, propidium iodide. Shown are representative images from experiments repeated > 3 times.