
IMAGE
Fig. S7
- ID
- ZDB-IMAGE-150430-4
- Genes
- Publication
- Alexander et al., 2014 - Wnt signaling interacts with bmp and edn1 to regulate dorsal-ventral patterning and growth of the craniofacial skeleton
- All Figures
- Figures for Alexander et al., 2014
Image
|
Figure Caption
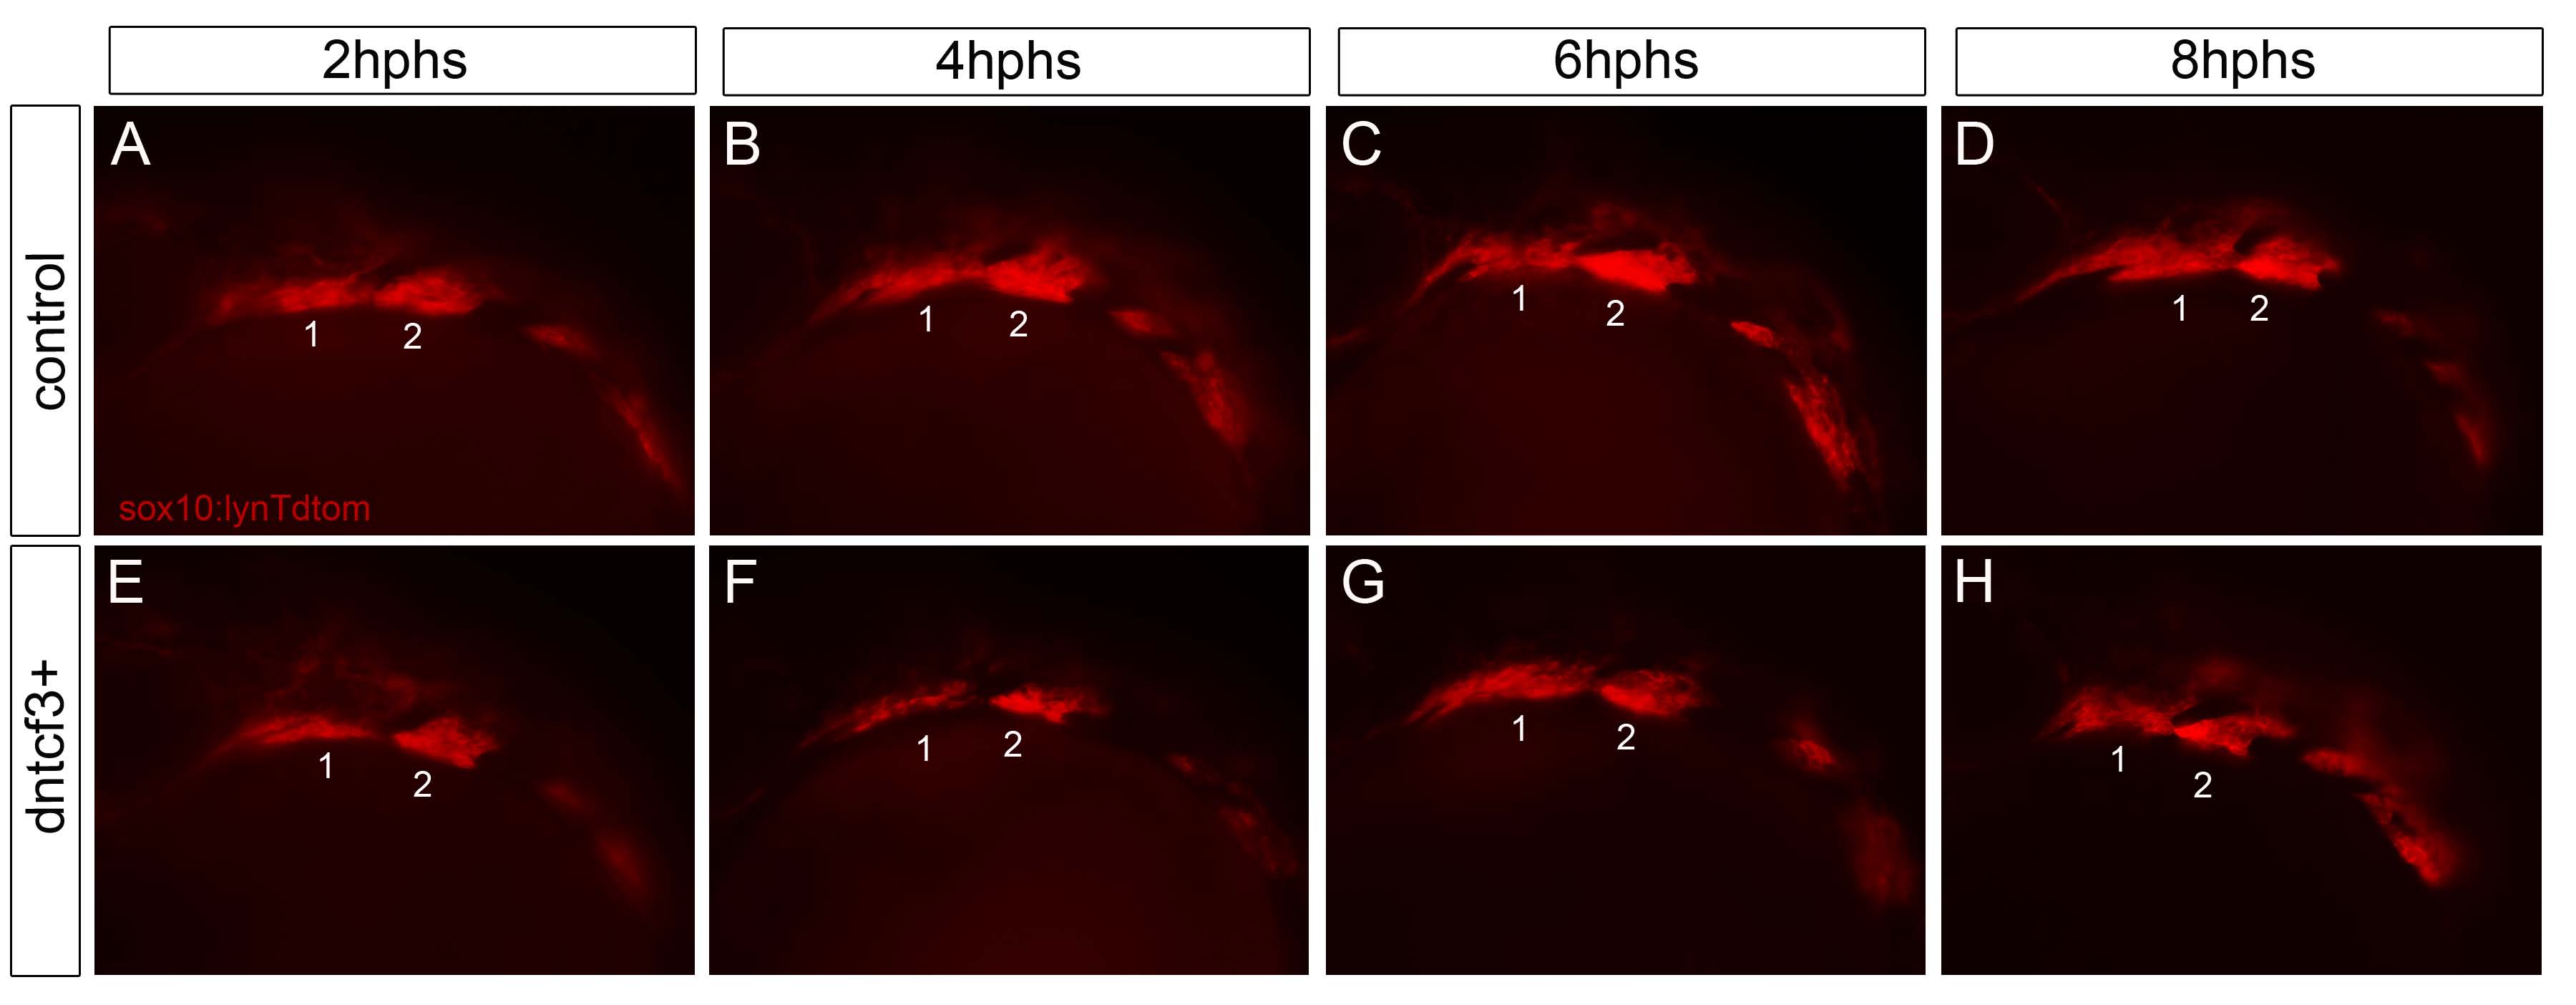
Fig. S7
Neural crest migration in dntcf3+ embryos. (A–H) Live images of Tg(sox10:lyn-Tdtomato) fluorescence in cranial neural crest cells in the arches in control (A–D) and dntcf3+ (E–H) embryos at 2 hour intervals post heatshock, lateral views, anterior to the left.
Figure Data
Acknowledgments
This image is the copyrighted work of the attributed author or publisher, and
ZFIN has permission only to display this image to its users.
Additional permissions should be obtained from the applicable author or publisher of the image.
Full text @ PLoS Genet.