
|
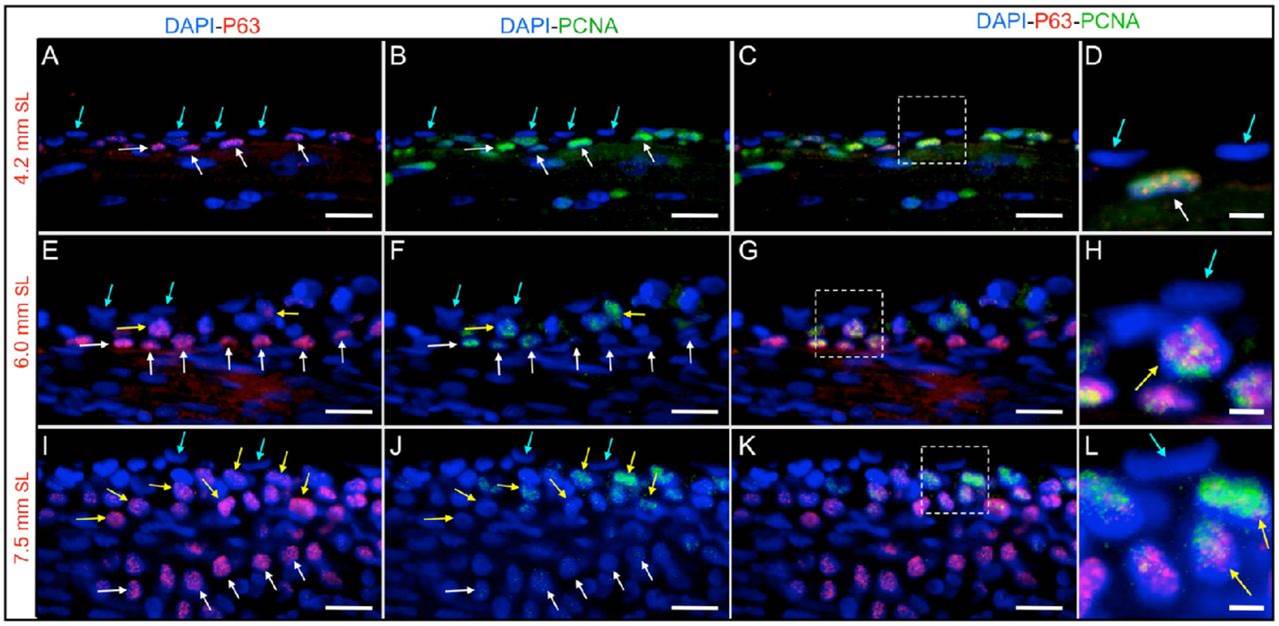
Fig. 5
Zebrafish epidermal stratification as a consequence of the proliferation of P63-expressing cells.
(A–D) Longitudinal sections from larvae with a SL of 4.2mm. (E–H) Longitudinal sections of larvae with a SL of 6mm. (I–L) Longitudinal sections of larvae with a SL of 7.5mm. (A, E and I) P63 and DAPI labeling. (B, F and J) PCNA and DAPI immunofluorescence. (C, G and K) Merged P63, PCNA and DAPI stainings; the colocalization of P63 and DAPI appears magenta, and the colocalization of P63 and PCNA appears yellow. (D, H and L) Higher magnification images of the regions marked by squares in (C, G and H), respectively. Prior to the initiation of stratification (SL of 4.2mm), basal cells (P63 positive) express the proliferation marker PCNA; later, for a SL of 6mm, new suprabasal cells appear, also exhibiting P63 and PCNA co-labeling. For a SL of 7.5mm SL, suprabasal cells (P63 positive) are abundant, and only suprabasal cells show PCNA labeling. Blue arrows label cells from the external epidermal layer, yellow arrows mark suprabasal cells at intermediate layers that are positive for PCNA and P63 expression, white arrows label P63 positive cells from the basal layer. Bars are 20µm in length, except in (D, H and L), where they are 5µm in length.