
|
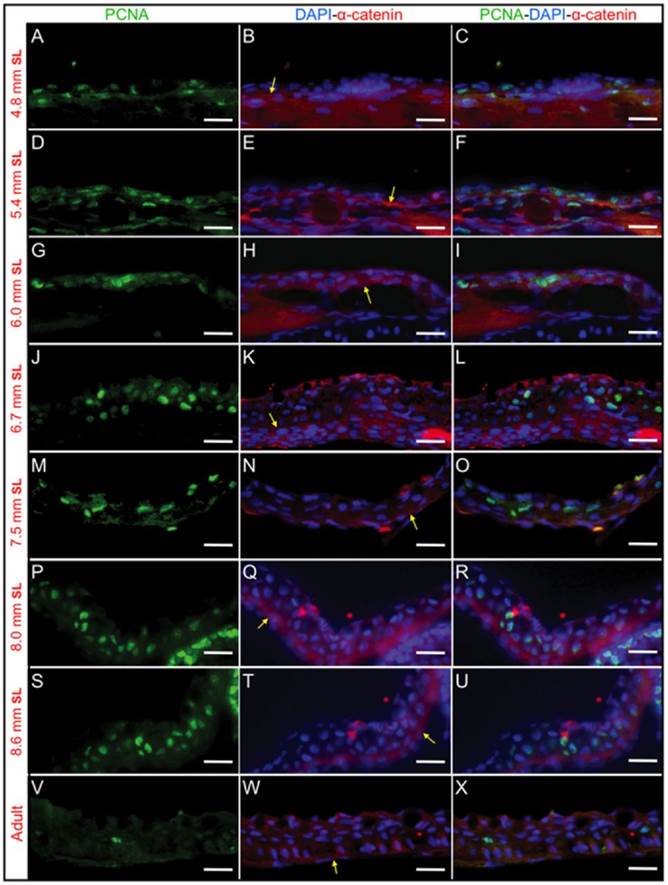
Fig. 4
PCNA and α-catenin immunostaining to show cell proliferation during epidermal stratification in the head area.
Anti-PCNA labels cells in proliferation and anti-α-catenin labels the basal membrane that separates the epidermis and dermis regions. (A–C), (D–F), (G–I), (J–L), (M–O), (P–R) and (S–U) show immunostained longitudinal sections of larvae with a SL of 4.8mm, 5.4mm, 6mm, 6.7mm, 7.5mm, 8mm and 8.6mm, respectively. (V–X) show immunostained longitudinal sections in adult fish. (A, D, G, J, M, P, S and V) PCNA immunostaining. (B, E, H, K, N, Q, T and W) Anti-α-catenin immunofluorescence merged with DAPI staining to label the nuclei. (C, F, I, L, O, R, U and X) Merged images of PCNA, α-catenin and DAPI staining. In some samples (like M–O) the epidermis get separated from the dermis, however this is artifactual. Yellow arrows mark the epidermal basal membrane where α-catenin labeling is abundant. Bar length is 20 µm.