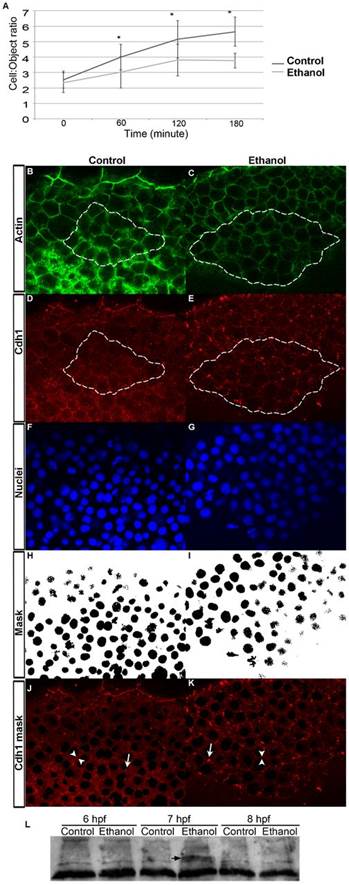
Fig. 4
Ethanol treatment reduces blastomere adhesion, but E-cadherin expression and distribution were only minimally affected.
(A) Cell adhesion assay using dissociated cells blastomeres. Graph showed cell-to-cell aggregation (object-to-cell ratios) of the dissociated control and ethanol treated blastomeres, which was reduced in ethanol treated cells. (B,C) Single confocal microscopy optical sections of the phalloidin stained prechordal plate cells in control and ethanol treated embryos at 8hpf. (D,E) Single confocal microscopy optical sections showed E-cadherin distribution in the prechordal plate cells in the control and ethanol treated embryos at 8hpf. White dotted lines indicate prechordal plate cells that were analyzed. (F,G) Co-staining with TO-PRO-3 labeled nuclei in the prechordal plate cells of control and ethanol treated embryos. (H,I) TO-PRO-3 was used as mask to exclude nuclei from E-cadherin intensity measurements. (J,K) E-cadherin distribution in the cytoplasm and cell surface after mask was applied. Arrowheads, cell surface; arrows, cytoplasmic aggregates. (L) Ethanol treatment did not change E-cadherin expression levels. Immunoblot analysis showed E-cadherin expression in the control and ethanol treated embryos at 6, 7 and 8hpf. Arrow indicates an E-cadherin isoform that accumulated, which migrated more slowly.

