
|
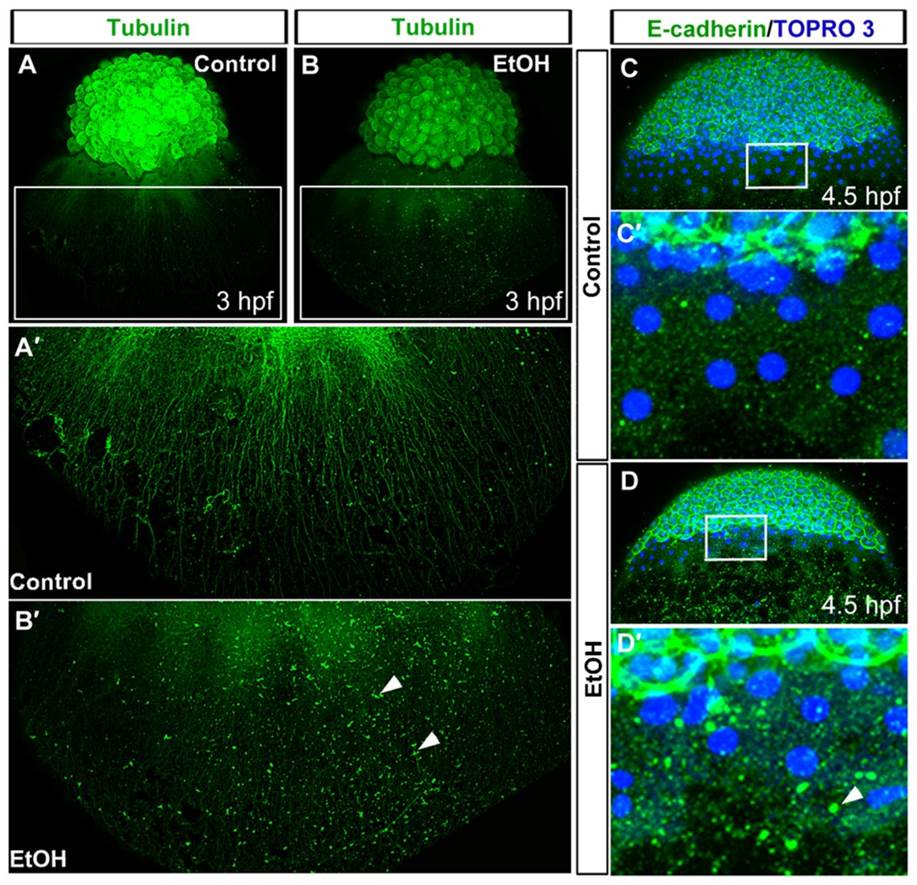
Fig. 2
Ethanol exposure disrupts yolk cell microtubule and E-cadherin distribution.
(A,B) 3D renderings of confocal microscopy optical sections of anti-α-tubulin antibody stained embryos showed microtubule organizations in the control (A) and ethanol treated (B) embryos at 3hpf. (A′,B′) High magnification image of the boxed regions of embryos showed arrays of yolk cell microtubule extending toward the vegetal pole in the control (A′) and abnormal arrays of yolk cell microtubules in the ethanol treated embryo (B′). Arrowheads indicate aggregates of α-tubulin in the yolk cell. (C–D′) 3D images of confocal microscopy optical sections of anti-E-cadherin antibody stained embryos showed E-cadherin distribution in the control (C) and ethanol treated (D) embryos at 4.5hpf. High magnification image of the boxed region of the control embryo showed relatively small aggregates of E-cadherin in the yolk cell (C′) than ethanol treated embryos, which had large aggregates of E-cadherin in the yolk cell (D′). Arrowhead indicates large E-cadherin aggregate.