
|
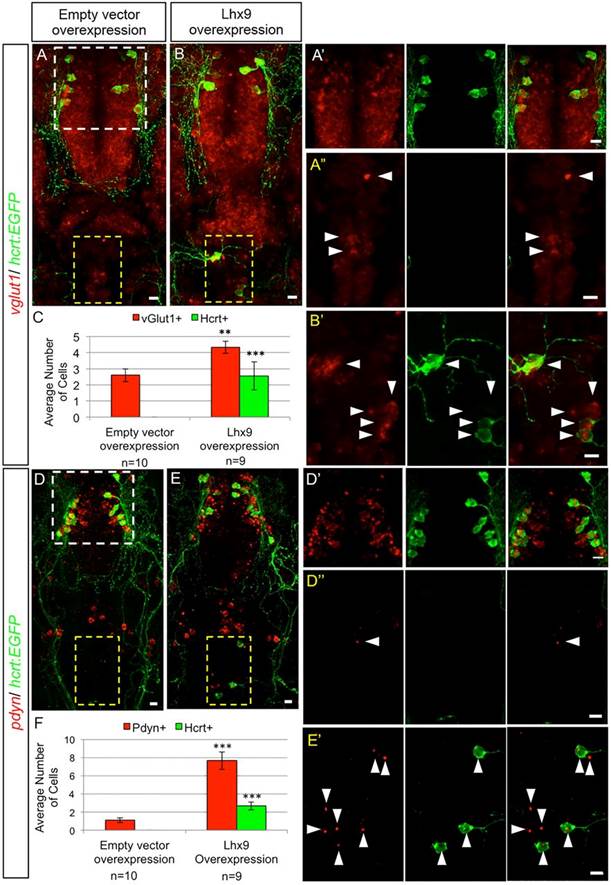
Fig. 4
Hypothalamic and ectopic Hcrt neurons share biomarkers. Confocal projections of 120hpf Tg(hcrt:EGFP) zebrafish larval brains containing endogenous and ectopic Hcrt neurons labeled with an anti-EGFP antibody and fluorescent ISH probes specific for vglut1 (A,B) and pdyn (D,E). White and yellow boxes in A,D indicate endogenous Hcrt neurons in the hypothalamus and endogenous vglut1 and pdyn expression in the hindbrain, respectively, shown enlarged in A′,D′ and in A′′,D′′. Yellow boxes in B,E indicate ectopic Hcrt neurons, as enlarged in B′,E′. All hypothalamic and ectopic Hcrt neurons express vglut1 and pdyn. Larvae injected with hs:lhx9 and heat-shocked at 24hpf contain ectopic Hcrt neurons in the hindbrain and more cells with strong vglut1 (B,B′) and punctate pdyn (E,E′) expression, compared with controls injected with an empty heat shock vector (A,A′′,D,D′′). Arrowheads indicate cells with strong vglut1 or pdyn expression. (C,F) Mean±s.e.m. number of cells in the yellow boxed regions. n, number of brains quantified. **P<0.01, ***P<0.001 compared with empty heat shock vector (Student′s t-test). Scale bars: 10µm.