
|
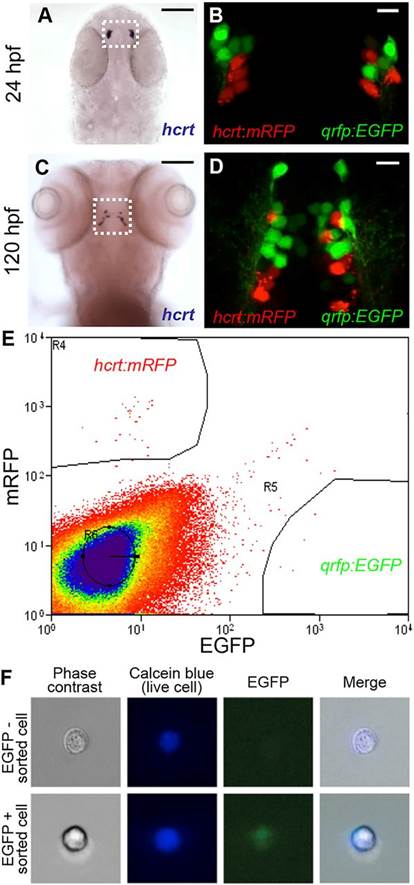
Fig. 1
Isolation of hcrt- and qrfp-expressing neurons from zebrafish embryos. (A-D) hcrt is expressed in bilateral populations of 4-6 neurons at 24hpf (A) and 10-15 neurons at 120hpf (C). Fluorescence in Tg(hcrt:mRFP, qrfp:EGFP) embryos is first observed at <24hpf. mRFP- and EGFP-labeled neurons are intermingled, but the markers are never co-expressed in the same cell (B,D). Boxed regions in A,C are shown at higher magnification in B,D. Scale bars: 100µm in A,C; 10µm in B,D. (E) Tg(hcrt:mRFP, qrfp:EGFP) embryos were dissociated into single cells at 26hpf and mRFP- and EGFP-expressing cells were isolated by FACS. The proportion of mRFP-positive and EGFP-positive cells was consistent with the number of Hcrt and QRFP neurons, respectively, in a 26hpf embryo. (F) EGFP is observed in a sorted qrfp:EGFP+ cell.