
Fig. S2
- ID
- ZDB-IMAGE-150427-17
- Publication
- Nakayama et al., 2013 - Gbx2 functions as a transcriptional repressor to regulate the specification and morphogenesis of the mid-hindbrain junction in a dosage- and stage-dependent manner
- All Figures
- Figures for Nakayama et al., 2013
|
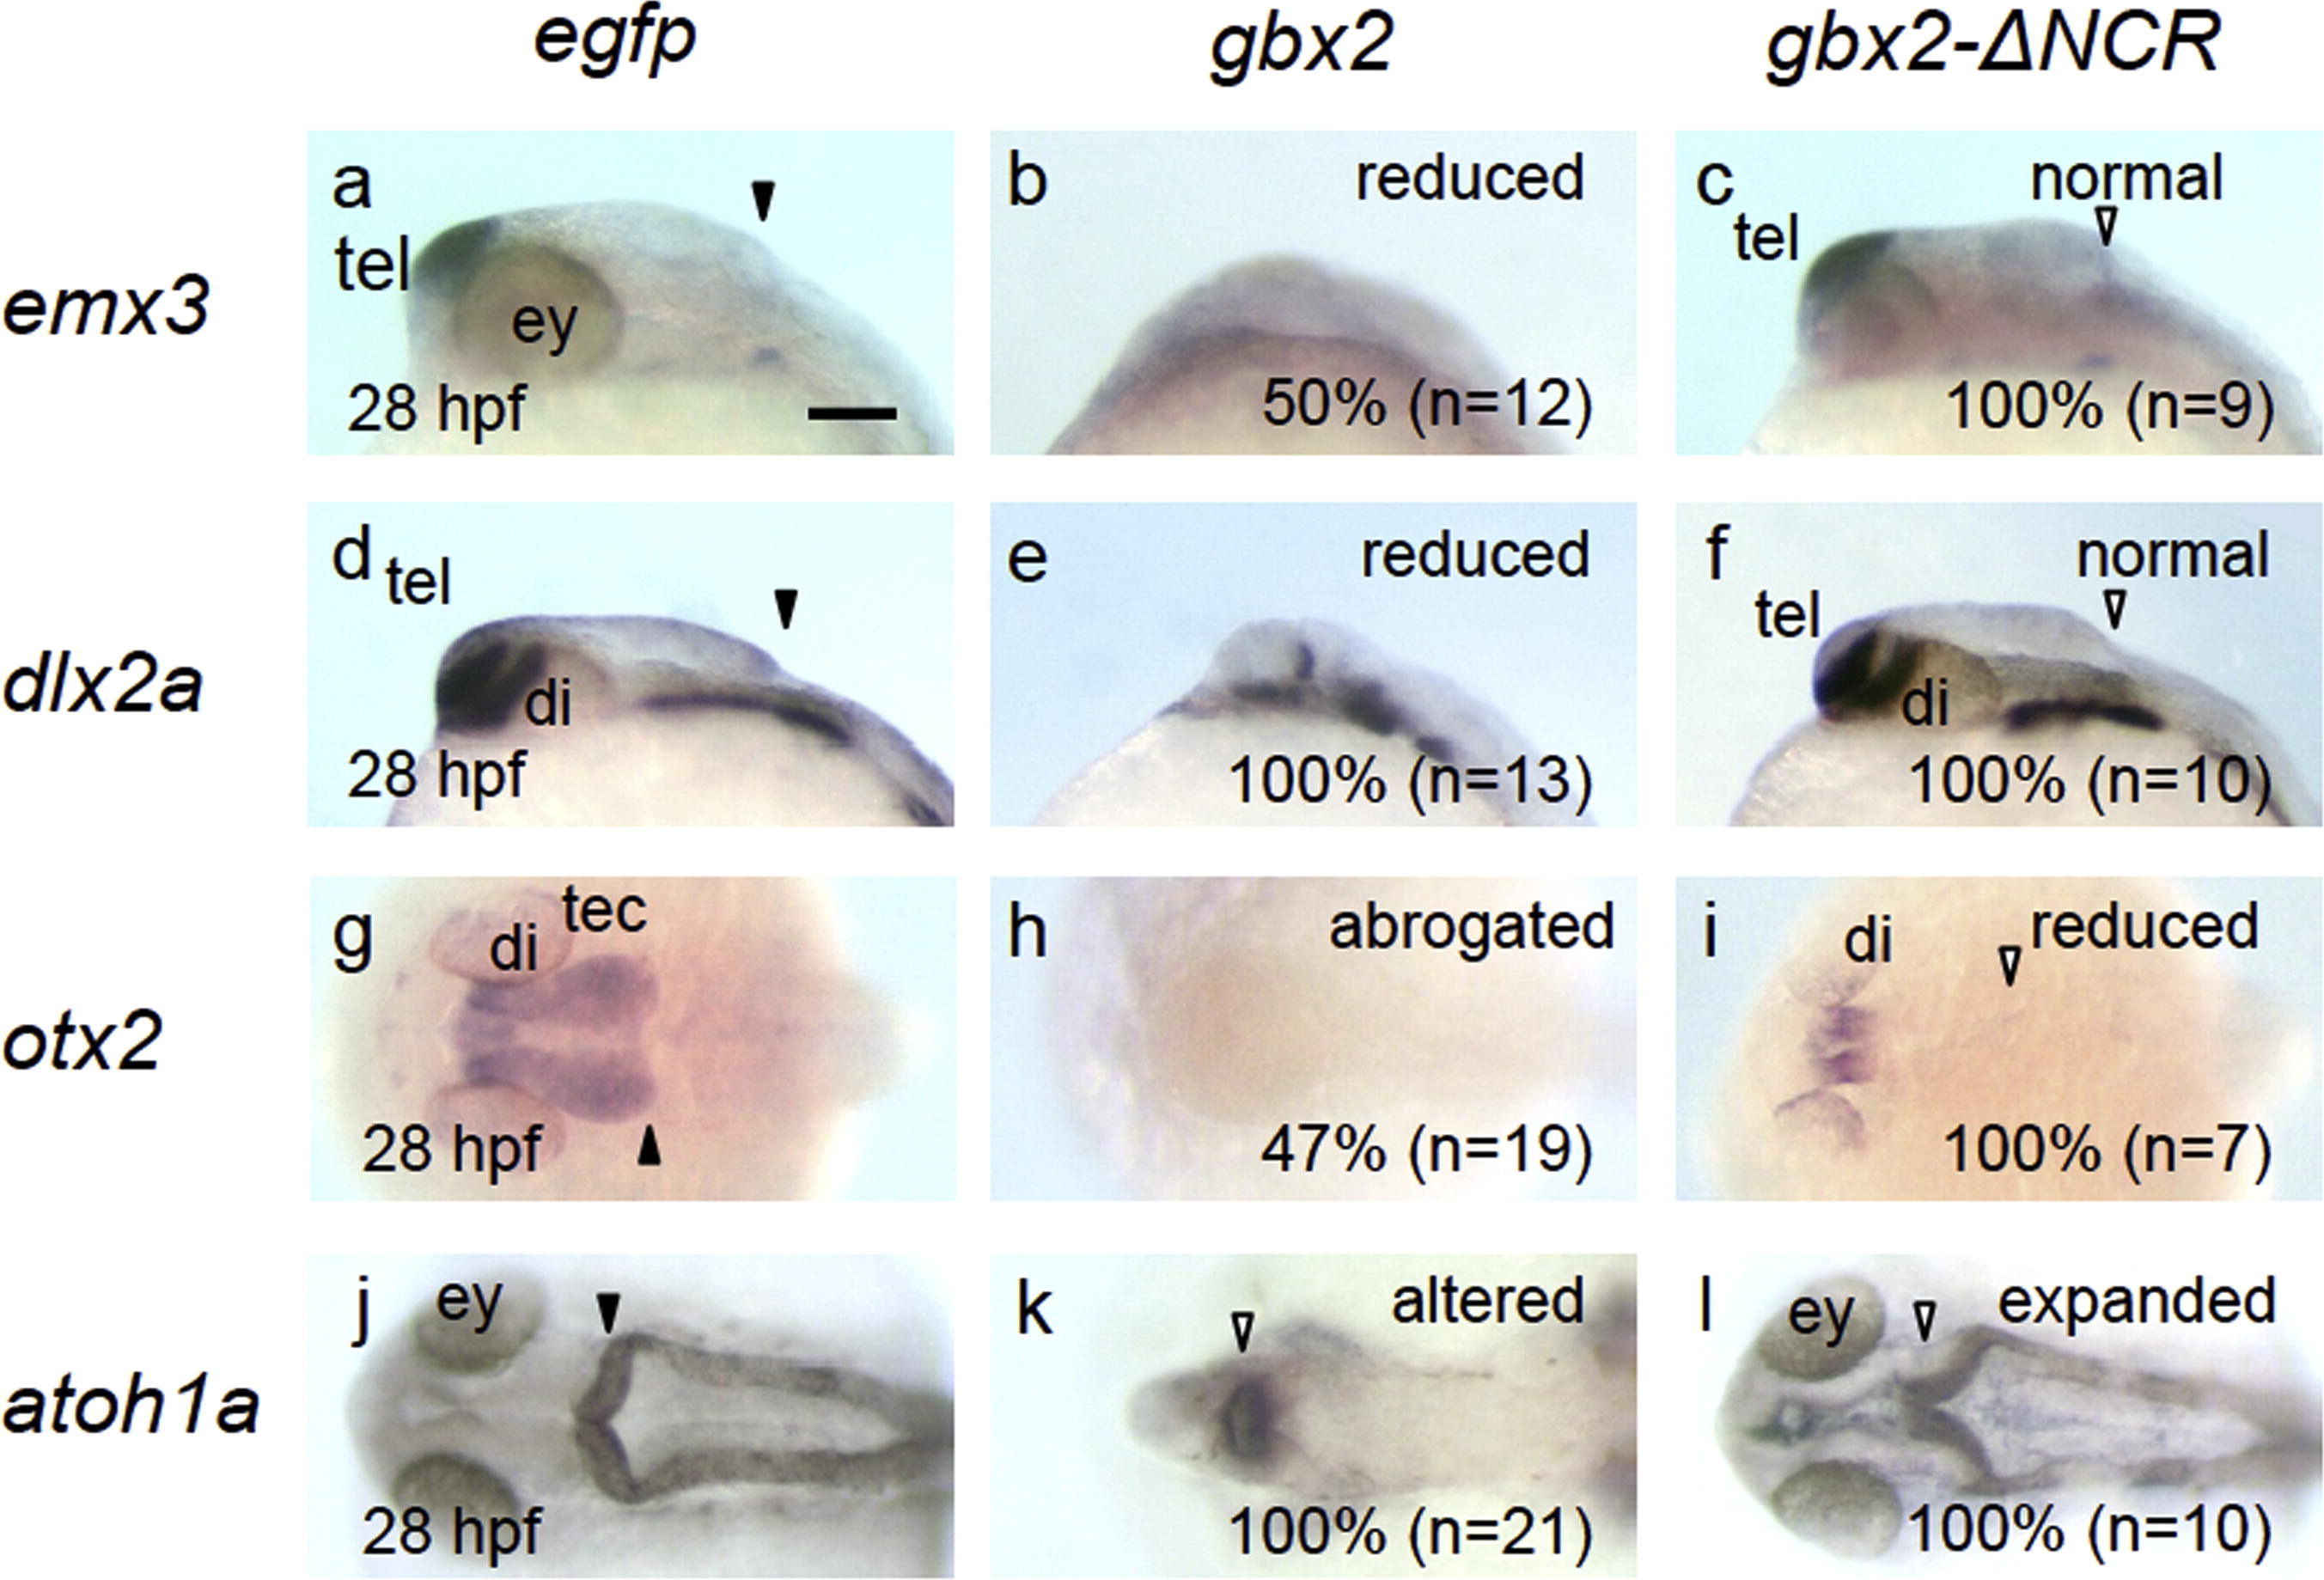
Fig. S2
Effects of overexpression of gbx2 and gbx2-ΔNCR on brain development. Embryos were injected with gbx2 mRNA of 30 pg/embryo (high dose) and gbx2-ΔNCR mRNA of 100 pg/embryo and examined at 28 hpf for the expression of brain regional markers shown on the left. Lateral (a–f) and dorsal (g–l) views are shown. For the embryos expressing gbx2 and gbx2-ΔNCR, typically affected embryos were chosen and subject to whole mount in situ hybridization, and all the embryos examined assumed the expression patterns shown here. Normal and disrupted isthmuses are marked with solid and open large triangles, respectively. di, diencephalon; ey, eye; tec, tectum; tel, telencephalon. Scale bars, 100 µm.
Reprinted from Mechanisms of Development, 130(11-12), Nakayama, Y., Kikuta, H., Kanai, M., Yoshikawa, K., Kawamura, A., Kobayashi, K., Wang, Z., Khan, A., Kawakami, K., and Yamasu, K., Gbx2 functions as a transcriptional repressor to regulate the specification and morphogenesis of the mid-hindbrain junction in a dosage- and stage-dependent manner, 532-52, Copyright (2013) with permission from Elsevier. Full text @ Mech. Dev.