
Fig. S2
- ID
- ZDB-IMAGE-150420-9
- Publication
- Paolini et al., 2015 - Asymmetric inheritance of the apical domain and self-renewal of retinal ganglion cell progenitors depend on Anillin function
- All Figures
- Figures for Paolini et al., 2015
|
Fig. S2
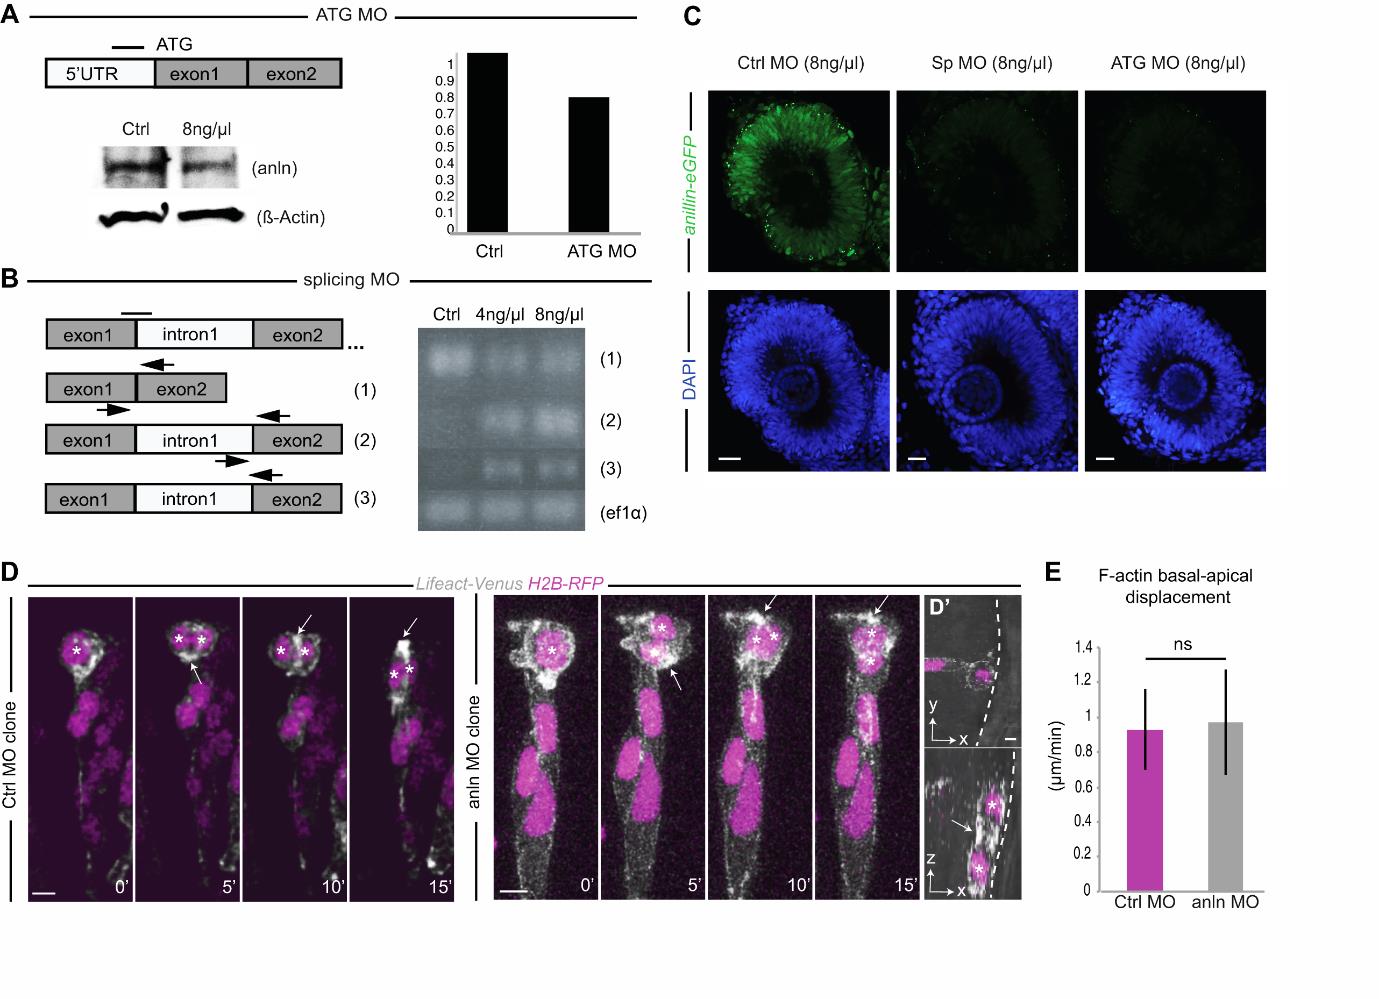
Anillin-specific morpholinos efficiently downregulate anillin. (A) Anillin-specific translation-blocking morpholino (ATG MO). Western blot showing 24.63% downregulation of endogenous Anillin expression levels. β-actin was used as the loading control. (B) Anillin splice-blocking MO (Sp MO). Black arrows indicate the binding site splice-assay primers assessed by RT-PCR. On the right, a decrease of the properly spliced form (1) and an increase of the intron 1 retention forms (2 and 3) are evident at 30 hpf. ef1a was used as a housekeeping gene. (C) Injection of both morpholinos efficiently decrease Anillin-eGFP expression in anillin:anillin-eGFP transgenic embryos. Scale bar: 100 µm. (D) Basal to apical displacement of the F-actin spot (LifeAct-Venus) during cytokinesis progression in a control MO and anlnMO cell clone. Each image represents the extended focus of a confocal stack. Asterisks indicate the position of nuclei (H2B-RFP). Scale bar: 5.1 µm. (D′) Orthogonal views of the division (t=5′) in the anlnMO clone, which remains parallel to the apical surface of the epithelium (highlighted with the white dashed line). Scale bar (white arrow): 10 µm. (E) Average F-actin spot basal to apical displacement during furrowing is not significantly different between control (magenta) and anillin MO (grey) clones (from 0.93 µm/minutes ± 0.2 µm/minutes SEM CtrlMO to 0.97 µm/minutes ± 0.3 µm/minutes SEM anlnMO, Student’s t-test p=0.6, CtrlMO-injected n=30; AnlnMO-injected, n=27). Apical surface of the retinal neuroepithelium to the top.