
|
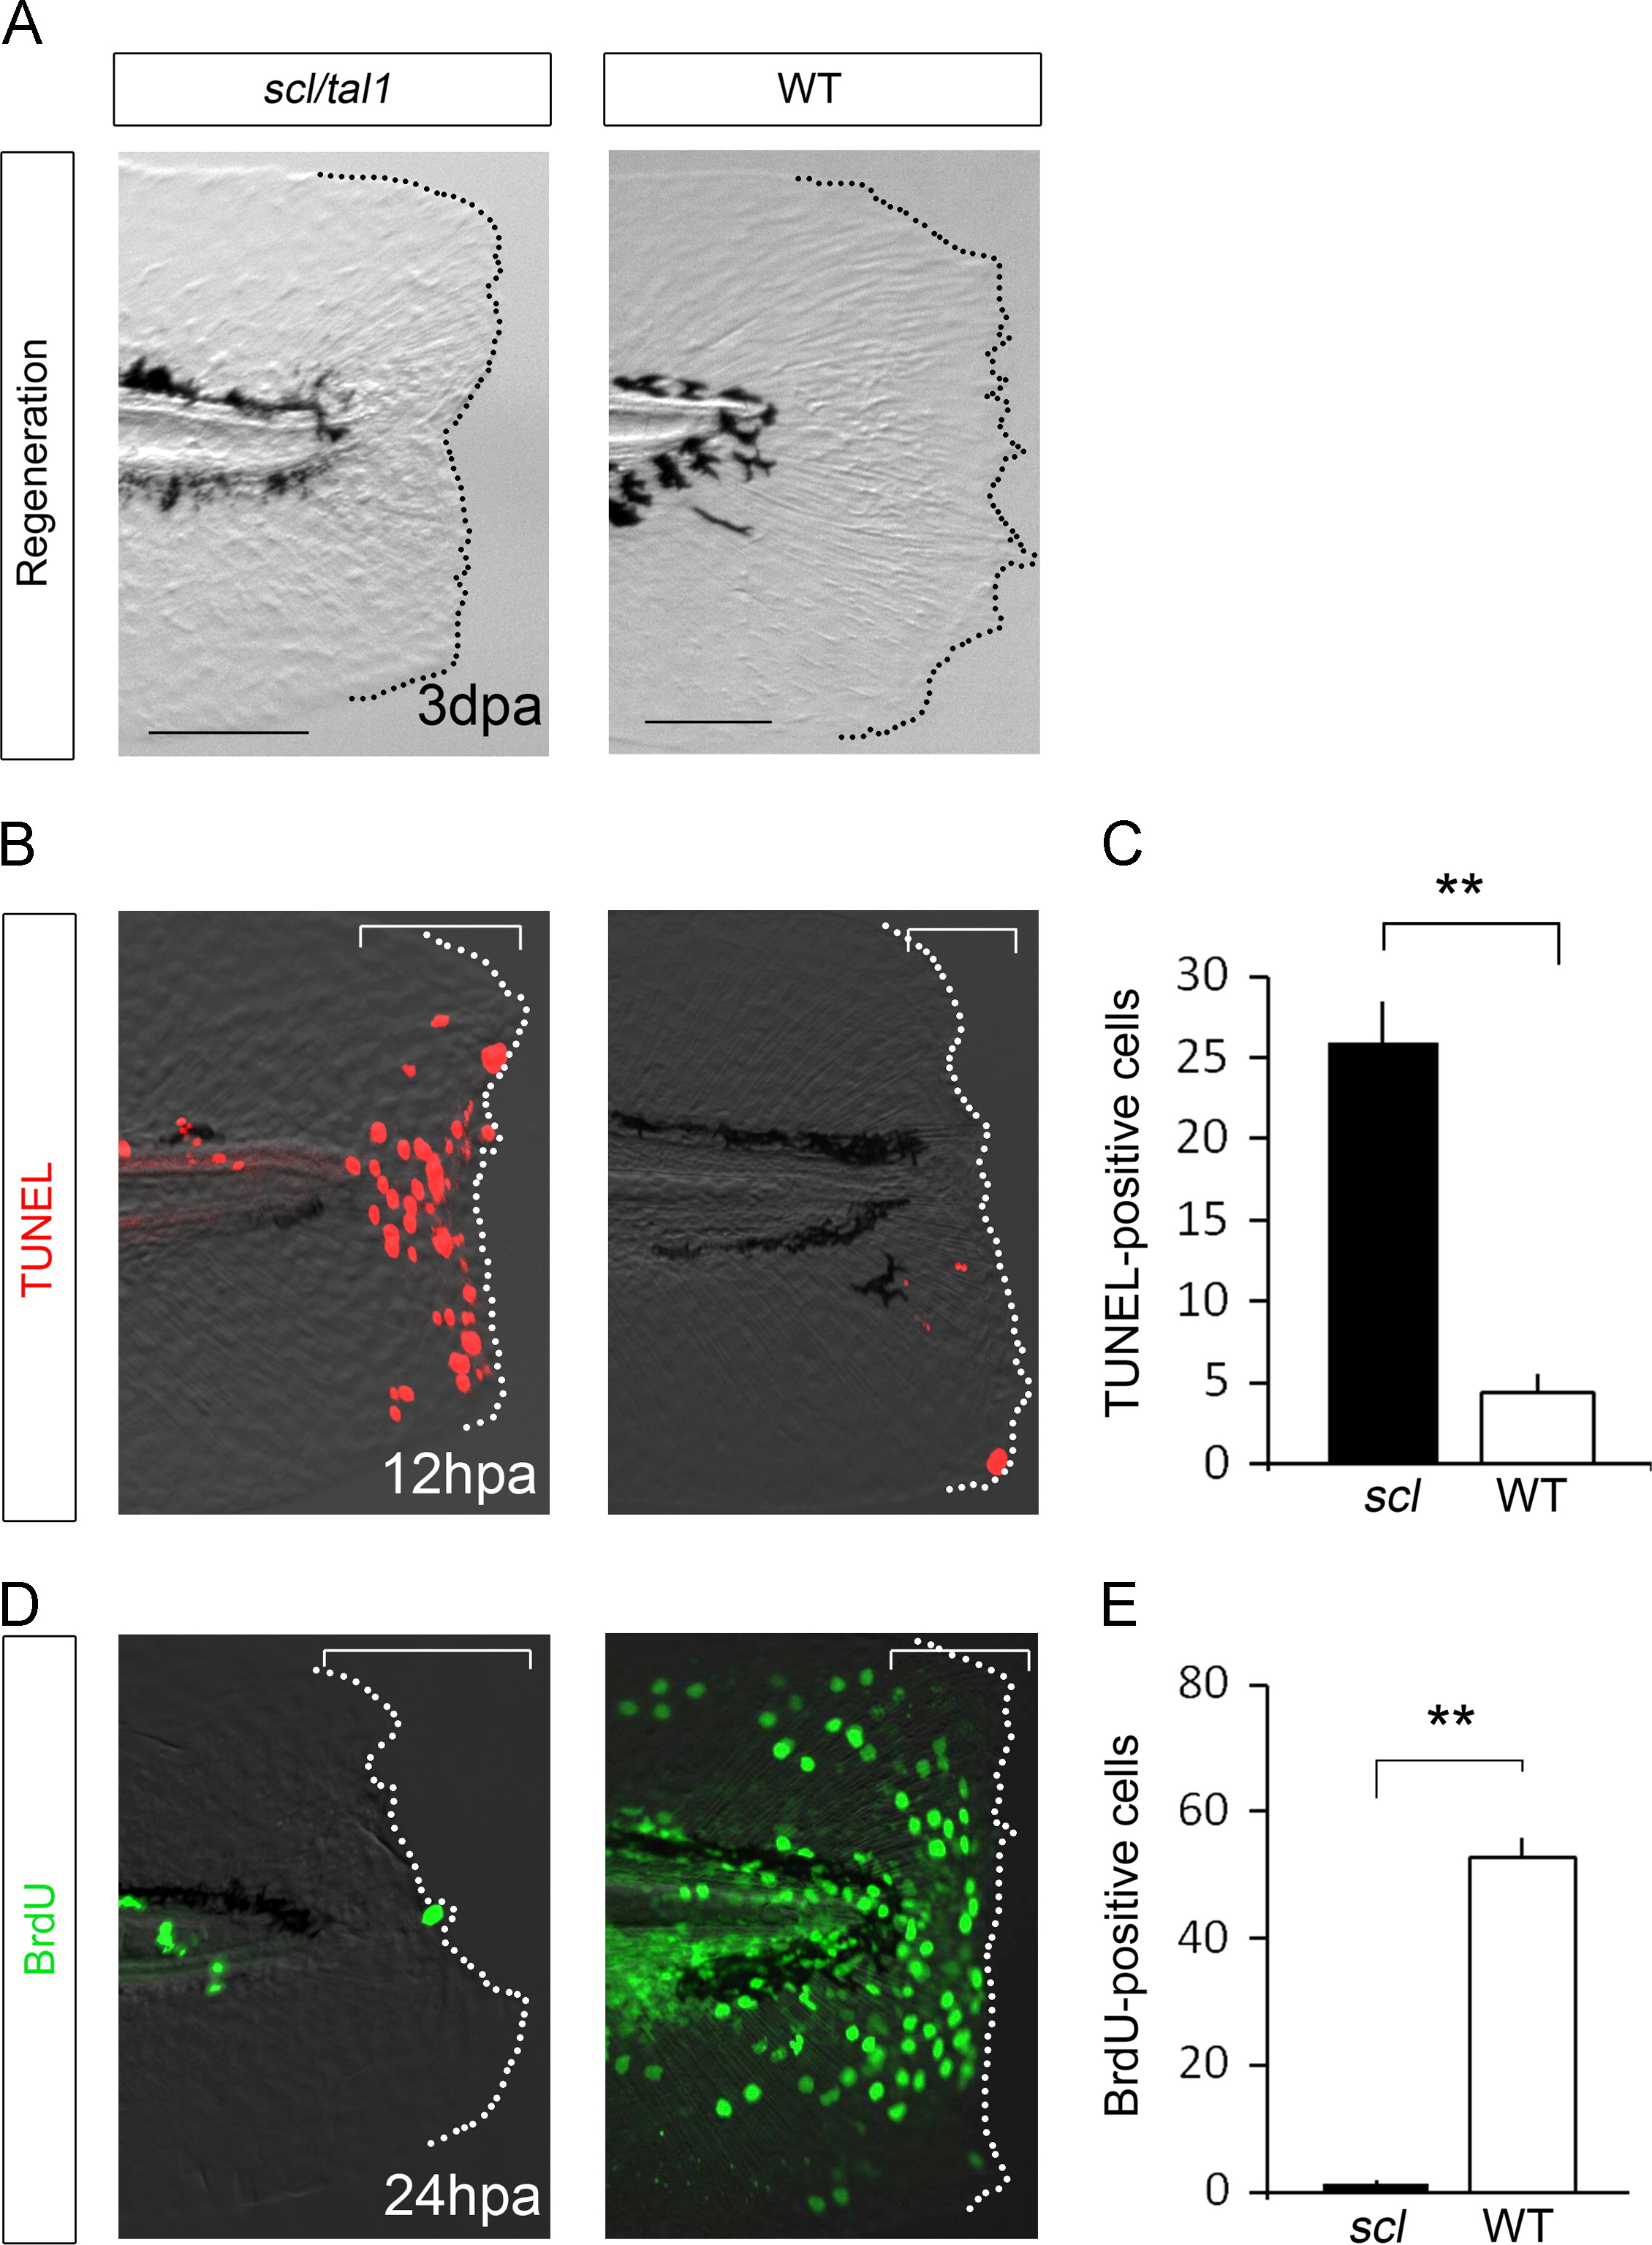
Fig. 4
Regeneration phenotype in the tal1 mutant. (A) Regeneration of fin fold in the tal1 mutant and sibling wild-type at 3 dpa. Regeneration in the tal1 mutant was severely impaired. (B) TUNEL analysis of amputated fin fold in the tal1 and sibling wild-type at 12 hpa. (C) Quantification of TUNEL analysis. The graph shows the number of TUNEL-positive cells in the tal1 mutant (n=18) and wild-type (n=10). (D) BrdU analysis of cell proliferation of amputated fin fold in the tal1 and sibling wild-type. The BrdU labeling was performed 0–24 hpa. (E) Quantification of BrdU-positive cells. The graph shows the number of BrdU-positive cells in the clo mutant (n=6) and wild-type (n=7). The number of TUNEL and BrdU-positive cells was quantified in the bracketed areas. Data in (C) and (E) are presented as mean±s.e.m. Statistical significance was tested using Welchós t test. **P<0.001. The dotted lines indicate the outline of the fin fold. Scale bars for clo and wild-type represent 100 µm, respectively.
Reprinted from Developmental Biology, 399(1), Hasegawa, T., Nakajima, T., Ishida, T., Kudo, A., Kawakami, A., A diffusible signal derived from hematopoietic cells supports the survival and proliferation of regenerative cells during zebrafish fin fold regeneration, 80-90, Copyright (2015) with permission from Elsevier. Full text @ Dev. Biol.