
|
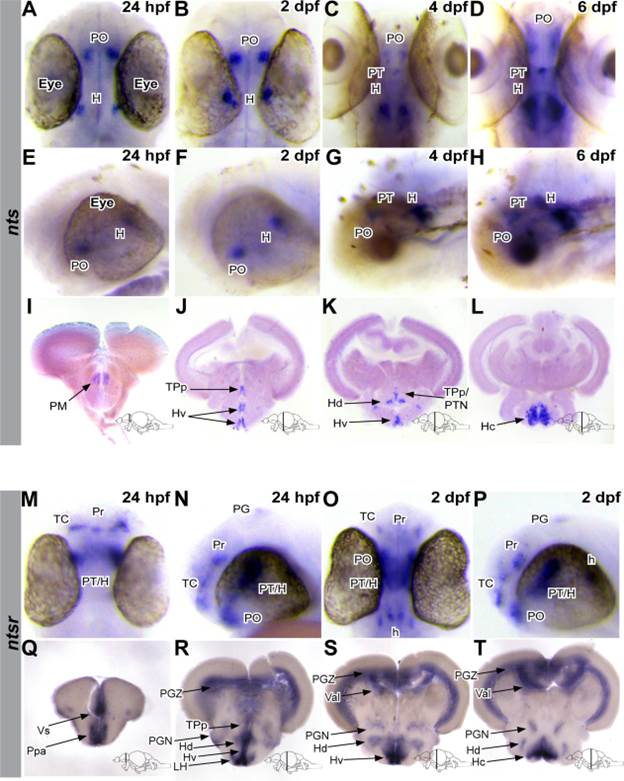
Fig. 2 The spatial and temporal expression pattern of nts and ntsr throughout zebrafish development. Ventral (A–D) and lateral (E–H) views of a wholemount ISH experiment in larvae, using a probe for nts. A–H: 24 hpf, 2 dpf, 4 dpf, and 6 dpf larvae expressing nts in the PO and H. At 4 and 6 dpf, nts is additionally observed in the PT. I–L: nts mRNA ISH pattern in 100 µm transversal adult brain sections. nts is expressed in the PM, TPp, PTN, Hv, Hd, and Hc of adult zebrafish brains. M–T: Dorsal (M,O), lateral (N,P), and 100 µm transversal adult brain section (Q–T) views of an ISH experiment using an ntsr probe. ntsr is widely expressed throughout the brain, including areas of the telencephalon, diencephalon (TP and hypothalamus), and hindbrain. PO, preoptic region; H, hypothalamus; PM, magnocellular preoptic nucleus; TPp, periventricular nucleus of the posterior tuberculum; PTN, posterior tuberal nucleus; Hv, ventral zone of the periventricular hypothalamus; Hd, dorsal zone of the periventricular hypothalamus, Hc, caudal zone of the periventricular hypothalamus; TC, telencephalic cluster; Pr, pretectum; PT, posterior tuburculum; PG, pineal gland; h, hindbrain; Vs, supracommissural nucleus of V; Ppa, parvocellular preoptic nucleus, anterior part; PGZ, periventricular gray zone of optic tectum; PGN, preglomerular nucleus; LH, lateral hypothalamus; Val, lateral division of valvula cerebelli.