
Image
|
Figure Caption
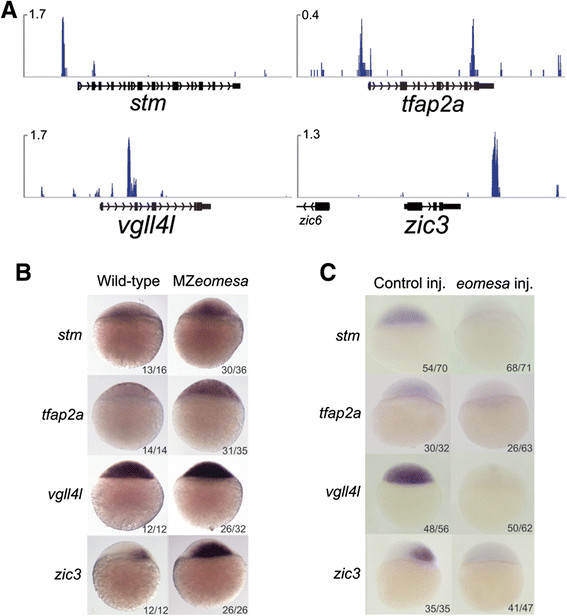
Fig. 6 Eomesa negatively regulates neural marker gene expression. (A) ChIP-seq data showing binding of Eomesa at sphere stage proximal to neural marker genes; scale in reads per million reads. (B)In situ hybridisation of wild type and MZeomesa mutant embryos for stm, tfap2a, vgll4l and zic3 showing upregulation of these genes (lateral view, animal to the top). (C)In situ hybridisation of control injected and eomesa injected embryos for stm, tfap2a, vgll4l and zic3 showing downregulation of these genes (lateral view, animal to the top). ChIP, chromatin immunoprecipitation sequencing.
Acknowledgments
This image is the copyrighted work of the attributed author or publisher, and
ZFIN has permission only to display this image to its users.
Additional permissions should be obtained from the applicable author or publisher of the image.
Full text @ BMC Biol.