
Fig. 2
- ID
- ZDB-IMAGE-150406-13
- Publication
- Tzung et al., 2015 - Early Depletion of Primordial Germ Cells in Zebrafish Promotes Testis Formation
- All Figures
- Figures for Tzung et al., 2015
|
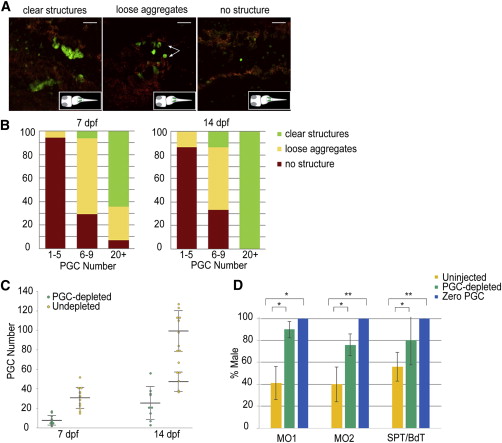
Fig. 2
Masculinization Ensues in PGC-Depleted Zebrafish
(A) Representative images of gonads show morphological variants following PGC depletion. Images are average intensity projections of confocal z stacks showing GFP (+) cells (green) and background autofluorescence (red). Scale bars represent 50 µm.
(B) The relative percentage of morphological variants observed during development based on resultant PGC number at 7 and 14 dpf following depletion.
(C) Density dot plot showing the stage-specific PGC number in PGC-depleted (6–9 PGCs, green; 7 dpf, n = 17 and 14 dpf, n = 15) and undepleted (>20 PGCs, yellow; 7 dpf, n = 14 and 14 dpf, n = 16) larvae. The resultant PGC number at 14 dpf in PGC-depleted larvae shows a unimodal distribution, while remaining bimodal in the undepleted ones. Large horizontal bars indicate mean; smaller flanking bars indicate the SD.
(D) Relative percentage of male progeny resulting from two different methods of PGC-depletion: morpholino injection-MO1 (pairwise cross), MO2 (mass cross), and cell transplantation-SPT, BdT. The bar color indicates resultant PGC number zero (blue: n = 27, 29, 159 for MO1, MO2, and SPT/BdT), PGC-depleted (1–10 for MO1, 1–7 for MO2 and 1–9 for SPT/BdT, green; n = 111, 97, and 50 for MO1, MO2, and SPT/BdT) and uninjected controls (yellow: n = 237, 364, and 136 for MO1, MO2, and SPT/BdT). Bars indicate mean % ± SD of the mean percentages in four, six, four, and eight replicated experiments for MO1, MO2, SPT, and BdT, respectively. t test: p < 0.01; p < 0.001 calculated when PGC-depleted versus uninjected or zero PGC versus uninjected.
See also Figures S1 and S2.