
|
Fig. 2
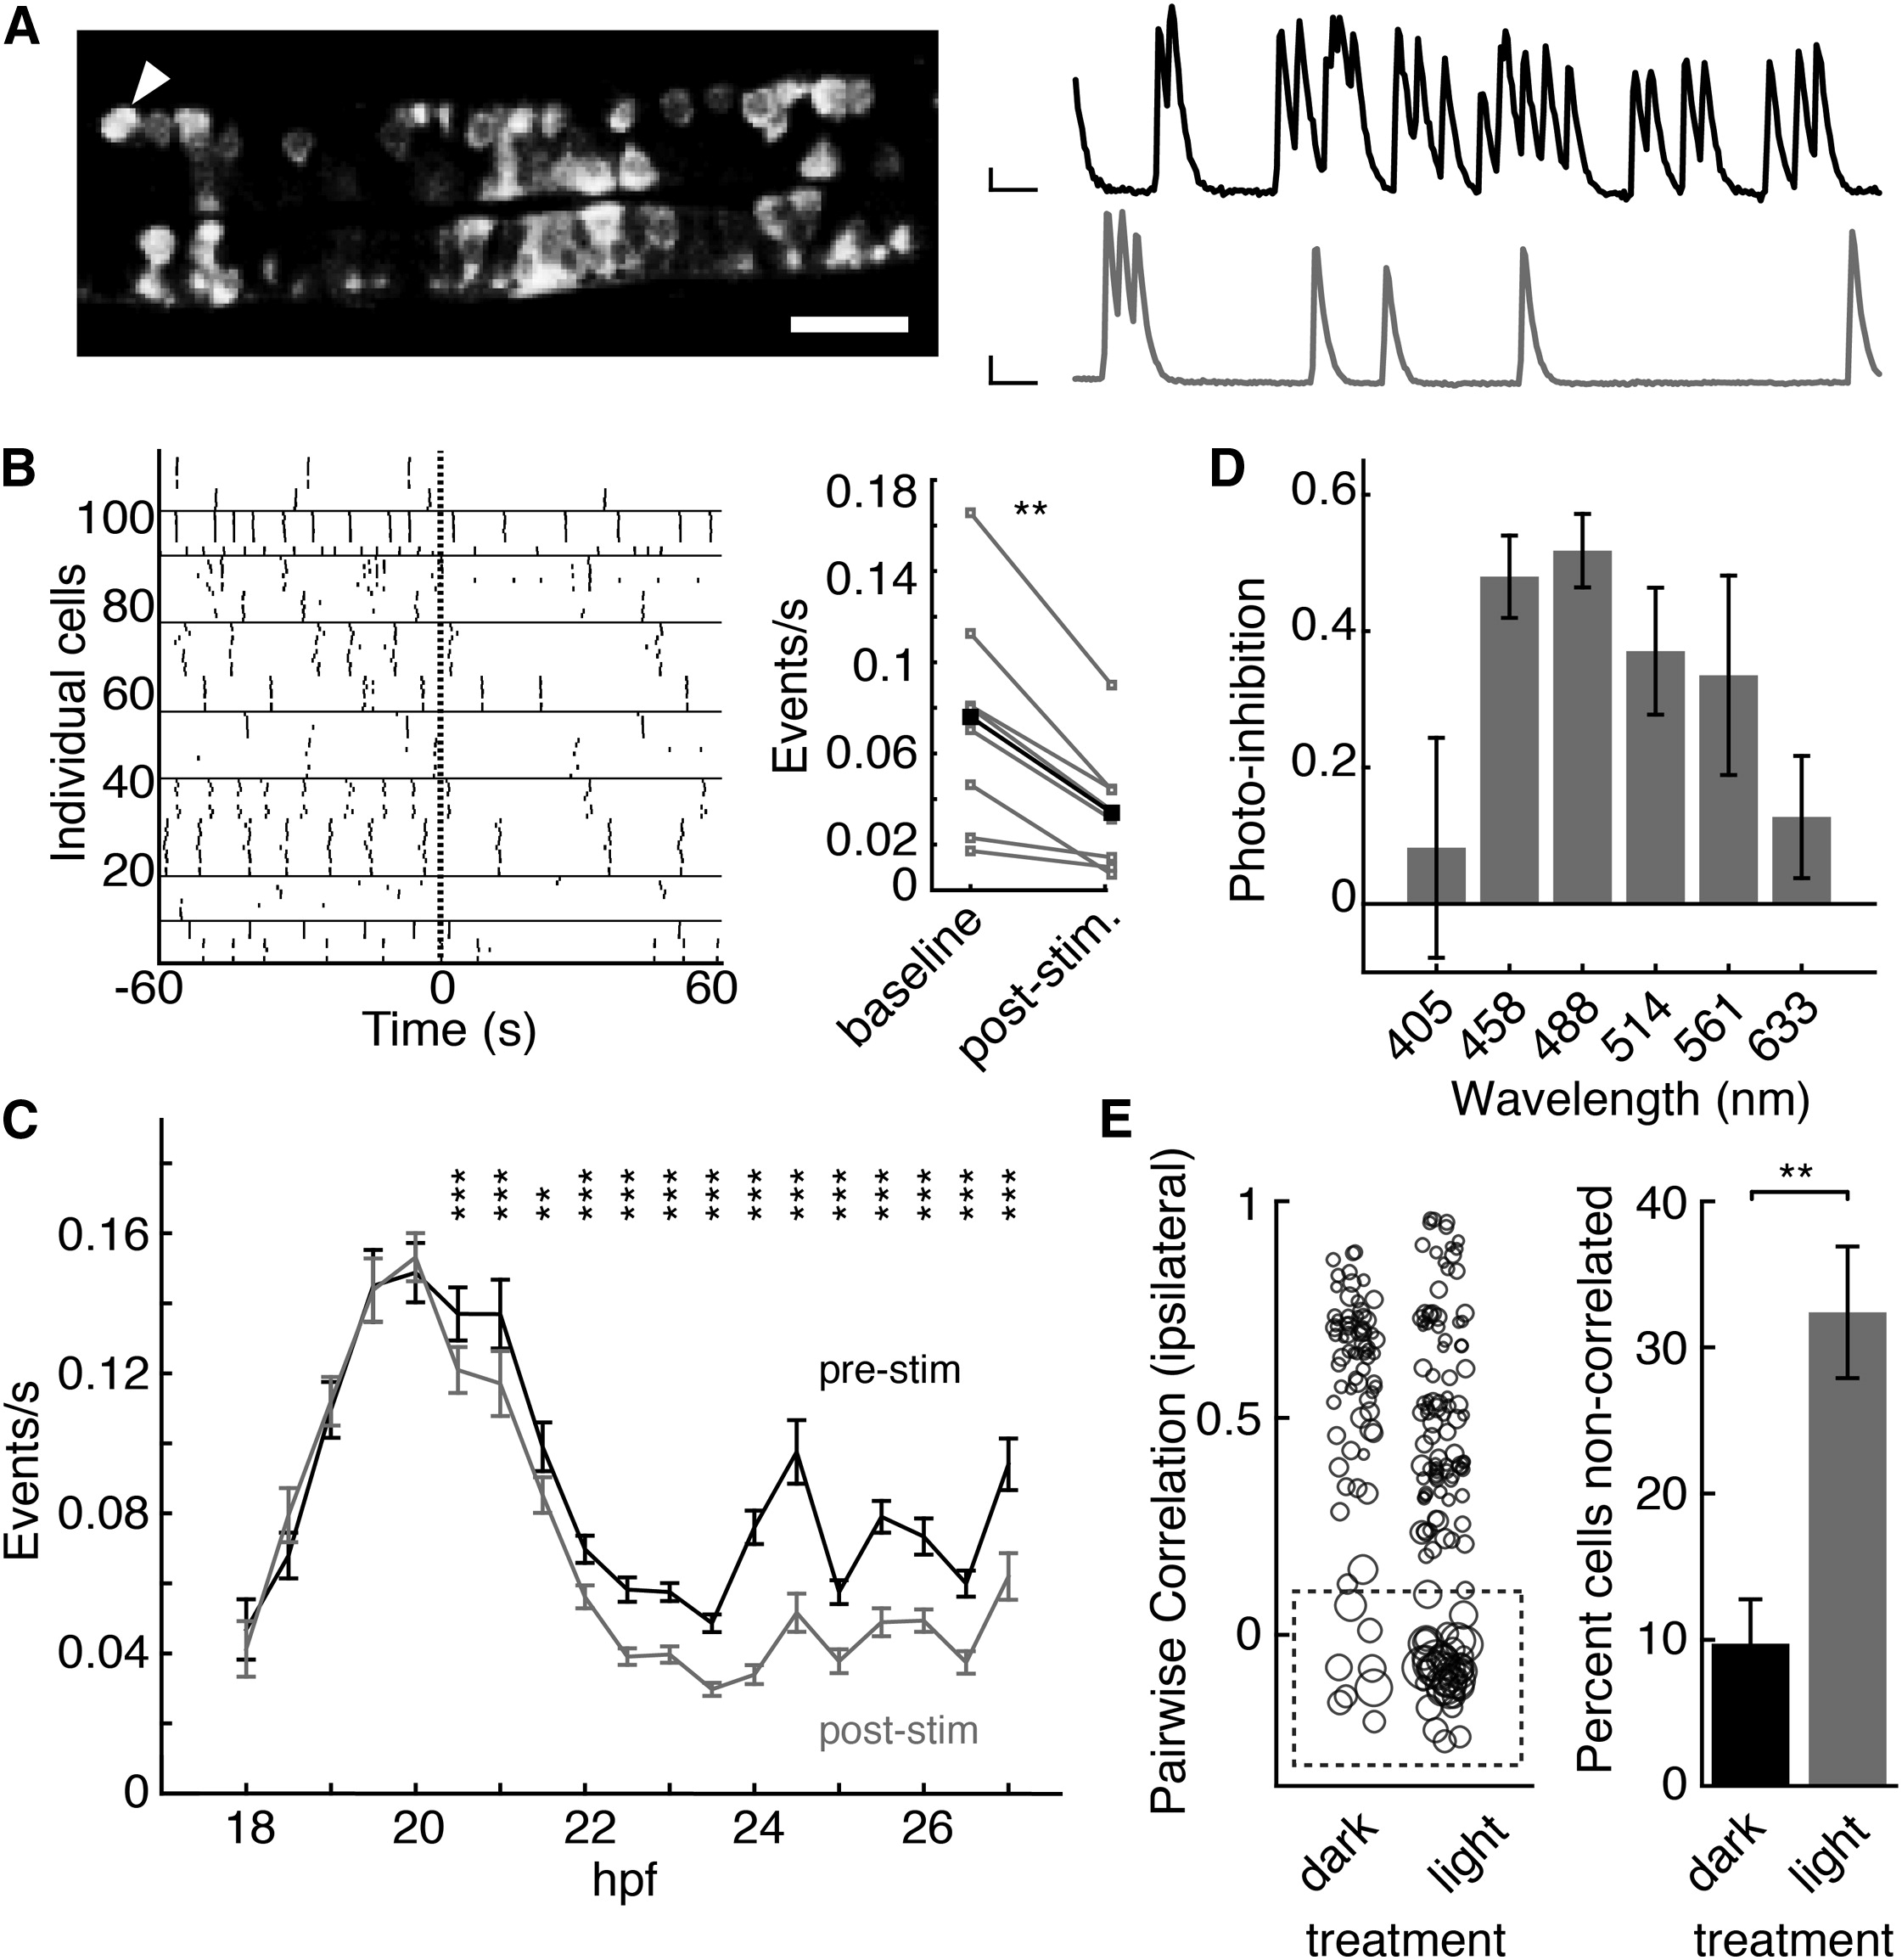
Acute and Delayed Effects of Light on Neural Activity
(A) Left, image of GCaMP5 fluorescence in ventral spinal cord somites 3–8 of a 1020:Gal4; UAS:GCaMP5 embryo. Scale bar, 20 µm. Right, calcium traces from one cell (arrowhead in image) under 2P (black trace, 920 nm) or subsequent period of 1P (gray trace, 488 nm) excitation, after <5 s interval. Axes: 100% ΔF/F, 10 s.
(B) Left, raster plot of 2P-imaged calcium events in 24 hpf embryos before and after a 5 s flash (dashed line) with 561 nm light. Measurements from each of eight fish (horizontal lines delineate individual fish). Right, quantification of calcium event frequency in the eight fish (gray lines; black line, mean) during a 180 s period under 2P excitation (baseline) and over 60 s after the 561 nm light flash (post-stim). Two-tailed paired t test p < 0.01.
(C) Frequency (mean ± SEM) of calcium events over 9 hr of development measured under 2P excitation before (pre-stim) and after (post-stim) a 5 s 561 nm light flash, as quantified in (B). Two-tailed paired t test, Bonferroni adjusted p values, p < 0.001, p < 0.01; n = 21–123 cells from four to eight fish at each age.
(D) Photoinhibition (mean ± SEM) after illumination with a 5 s light flash at varying wavelengths. 103–110 µW/pixel; n = 16 cells in eight fish at each wavelength.
(E) Left, pairwise ipsilateral correlations between cells in 22 hpf embryos after dark or light (508 nm, 13.2 µW/mm2) rearing for 2 hr before 20 hpf. Circle size proportional to event width at half max amplitude (range = 1.8–75.7 s). Dashed box demarcates noncorrelated cells. Right, percentage (±SEM) of noncorrelated cells (ipsilateral correlation <0.1) at 22 hpf. Two-tailed unpaired t test, p = 0.004. n = 6 (dark) and n = 8 (light) fish.
See also Figure S2.