Fig. 5
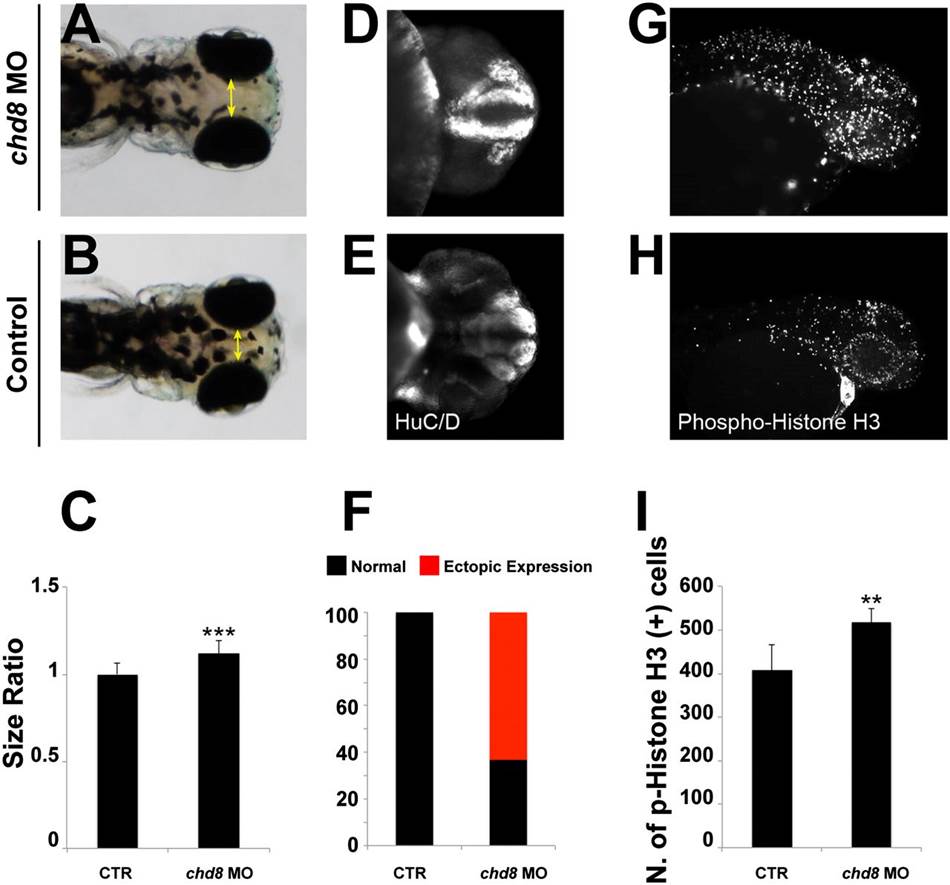
Injection of chd8 MO leads to macrocephaly, ectopic expression of HuC/D, and increased numbers of proliferating cells. (A and B) Representative images show dorsal views of an embryo injected with chd8 MO (A) and a sham-injected control (B). (C) Quantification of macrocephaly was performed in embryo batches by measuring the distance across the convex tip of the eye cups (yellow arrows) at 4.5 dpf (n = 70 embryos; repeated three times). The macrocephaly phenotype represents a 12% increase compared with controls. ***P < 0.0001 (Student t test). (D and E) Suppression of chd8 leads to increased ectopic expression of HuC/D at 2 dpf. Representative images (with HuC/D-antibody staining) show the ventral views of an embryo injected with chd8 MO and a sham-injected control. HuC/D levels in the anterior forebrain of the embryos injected with the chd8 MO are significantly higher than in controls. (F) Percentage of embryos with normal (black) or ectopic (red) HuC/D protein levels in the anterior forebrain in embryo batches injected with chd8 MO exhibit an ectopic expression of HuC/D compared with controls. (G and H) Phospho-histone H3 staining for proliferating cells in the zebrafish brain at 2 dpf. Representative images (with p-histone H3-antibody staining) show the lateral views of an embryo injected with chd8 MO and a sham-injected control. (I) Quantification of p-histone H3–positive cells from control embryos or embryos injected with chd8 MO (n = 20 embryos per group). Data are presented as the mean ± SEM. **P = 0.0018 (two-tailed t test comparisons between MO-injected and controls).

