
|
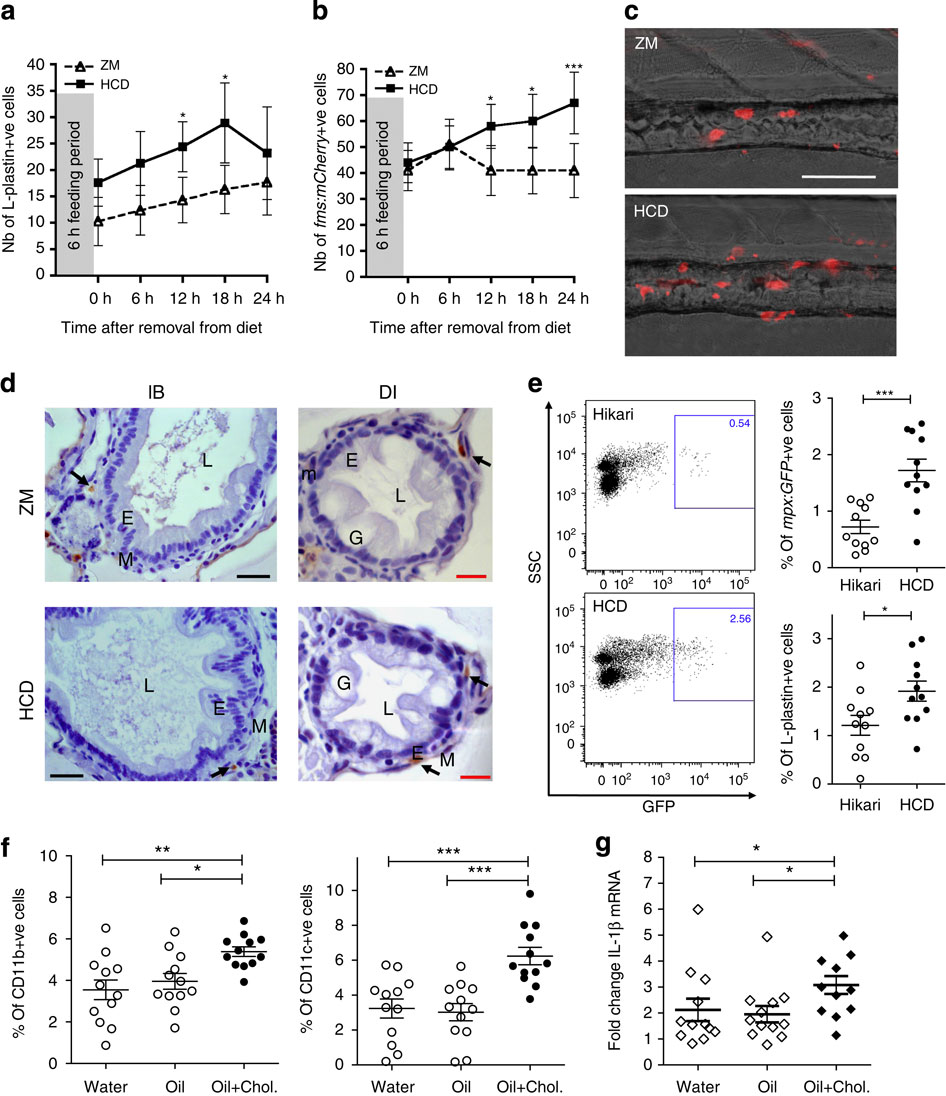
Fig. 2 HCD induces myeloid cell accumulation in the intestine.
(a) Total number of L-plastin+ cells in the intestine of 6 dpf WT larvae following HCD (squares) or ZM (triangles) for 6 h. Two-way analysis of variance (ANOVA). (b) Total number of mCherry+ cells in the intestine of Tg(fms:mCherry) larvae following HCD or ZM for 6 h. In a and b, one representative experiment of at least two with ne15 is shown. Error bars represent 95% confidence intervals. Two-way ANOVA. (c) Representative images of distal intestine of Tg( fms:mCherry) larvae after 18 h following ZM or HCD for 6 h. Scale bar, 100 µm. (d) L-plastin+ cells (arrow) localized to the muscularis of intestine layers; intestinal bulb (IB), distal intestine (DI), lumen (L), goblet cells (G), epithelial layer (E), muscularis (M). Scale bars, 20 µm (black); 10 µm (red). (e) Representative flow cytometry plots and quantification of GFP+ and L-Plastin+ cells of adult Tg( mpx:GFP) intestine tissue after 15 h following HCD or Hikari control for 6 h. Each dot represents one individual fish pooled from three experiments (n=11). Two-tailed t-test. One-way ANOVA. Error bars are s.e.m. (f) CD11b+ and CD11c+ cells in the small intestine (distal jejunum and ileum) of Balb/C mice 12 h after gavage with water, oil or oil+ cholesterol. One-way ANOVA. Error bars are s.e.m. (g) Fold change of IL-1β mRNA assessed qRT–PCR in the small intestines (ileum) of Balb/C mice. Relative expression values were normalised to 18S and expressed relative to one control sample. Kruskal–Wallis test. Error bars are s.e.m. In f and g, each dot represents one individual mouse and data are pooled from four experiments (n=12). ***P<0.001, **P<0.01 and *P<0.05.