
|
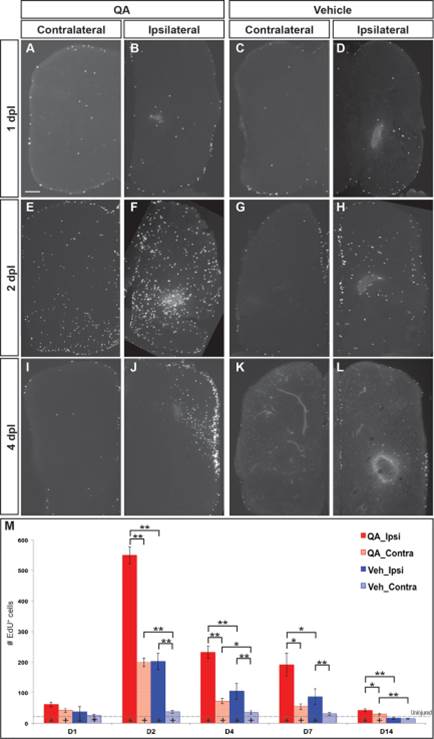
Fig. 3
Cell proliferation increases dramatically following injury. (A–D, M) At 1 day post injury, proliferation began to increase in the VZs and parenchyma of the lesioned telencephalic hemispheres. (E–H,M) Extensive proliferation was evident in both ipsilesional and contralesional hemispheres by 2 dpl, especially in the germinative zones and throughout the parenchyma of the ipsilesional hemispheres after QA- more than vehicle-induced lesions. (I–L,M) The number of proliferative cells was elevated to a lesser extent at 4 (I–L) and 7 (M) dpl and remained only slightly increased at 14 days (M). (M) Proliferating cell numbers were quantified at various timepoints following QA- (red) or vehicle-induced (blue) injury in the ipsilesional (solid) and contralesional (hatched) telencephalic hemispheres. ANOVA results indicated significant main effects on proliferation for lesion type (F(2, 76) = 81.943, P < 0.0001) and dpl (F(8, 154) = 21.224, P < 0.0001), as well as a significant interaction effect for type of lesion x dpl (F(8, 154) = 14.482, P < 0.0001). Post hoc analyses (Tukey HSD) for proliferation across type of lesion indicated significant differences in proliferation in the injured hemisphere among QA-lesioned, vehicle-lesioned and uninjured brains, and in the uninjured hemisphere between QA-lesioned and vehicle-lesioned or uninjured brains. Results from pairwise comparisons within each day (Student′s t-test with additional Bonferroni corrections) and with uninjured telencephalic hemispheres are indicated on the graph and in Supporting Information Table 1. *, P < 0.01; **, P < 0.001; +, P < 0.01 compared with uninjured (denoted by the dashed horizontal line). Scale bar = 100 µm.