
|
Fig. 1
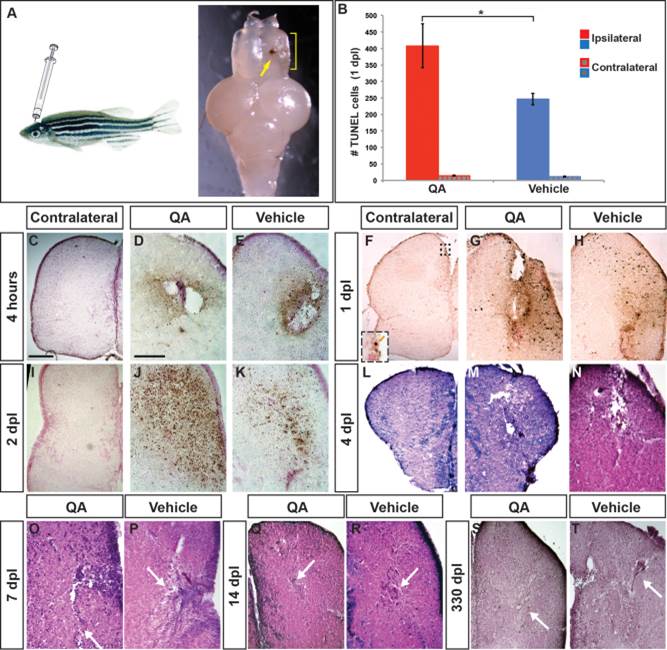
Telencephalic injury with QA results in early cell death followed by repair. (A) The adult zebrafish telencephalon was lesioned by injecting QA or vehicle orthogonally into the right hemisphere to a depth of approximately 2 mm. Two days postinjury, a blood clot identifies the injection track (arrow) and tissue disruption can be seen in the damaged hemisphere (yellow bracket). (B–K) Cell death was examined using a TUNEL assay. (B) The number of TUNEL-positive cells was quantified in the injured and uninjured hemispheres 1 day following QA or vehicle injection. Results from a one-way analysis of variance (ANOVA) indicated that both types of injury increased cell death, with more TUNEL-positive cells in the injured hemisphere following QA- than vehicle-induced injury (F(1,16) = 4.928, P < .05, n = 9). There was no difference in the number of TUNEL-positive cells on the contralateral side between QA and vehicle injuries (F(1,16) = 1.755, n.s.). (C, F, I) Very few apoptotic cells were seen on the uninjured side of the telencephalon following QA lesions (inset in F). (D,E) Dying cells appear near the injury site within 4 h after injury both in QA (D) and vehicle (E) conditions. (G,H) At 24 h postinjury the area of TUNEL reactivity has expanded in both QA- (G) and vehicle-injected (H) fish. TUNEL positive cells can be seen some distance from the injection site. (J,K) TUNEL positive cell numbers peak at 48 h postinjury, with a more extensive area of TUNEL reactivity in QA- (J) than vehicle-injured (K) brains. (L–T) H & E staining reveals extensive damage 4 days following both QA (M) and vehicle (N) lesions as shown by tissue loss at the site of injury and spongiform appearance in the surrounding areas. By 7 days post-lesion, tissue healing is apparent (white arrows in O, P), particularly following QA-induced lesions, and extensive repair is evident in lesioned tissue at 14 days post-lesion (white arrows in Q, R). More residual fibrous tissue was often seen following vehicle-induced lesions compared with QA-lesioned tissue. At 330 days post-lesion, morphological structure is largely intact in both QA- (S) and vehicle-lesioned (T) brains. Similar to early timepoints, fibrous remnants of vehicle-induced lesions are typically evident (arrow in T). Scale bar = 100 µm. Scale bar in C applies to F, I, L, M, S; scale bar in D applies to E, G, H, J, K, N, O, P, Q, R, T.