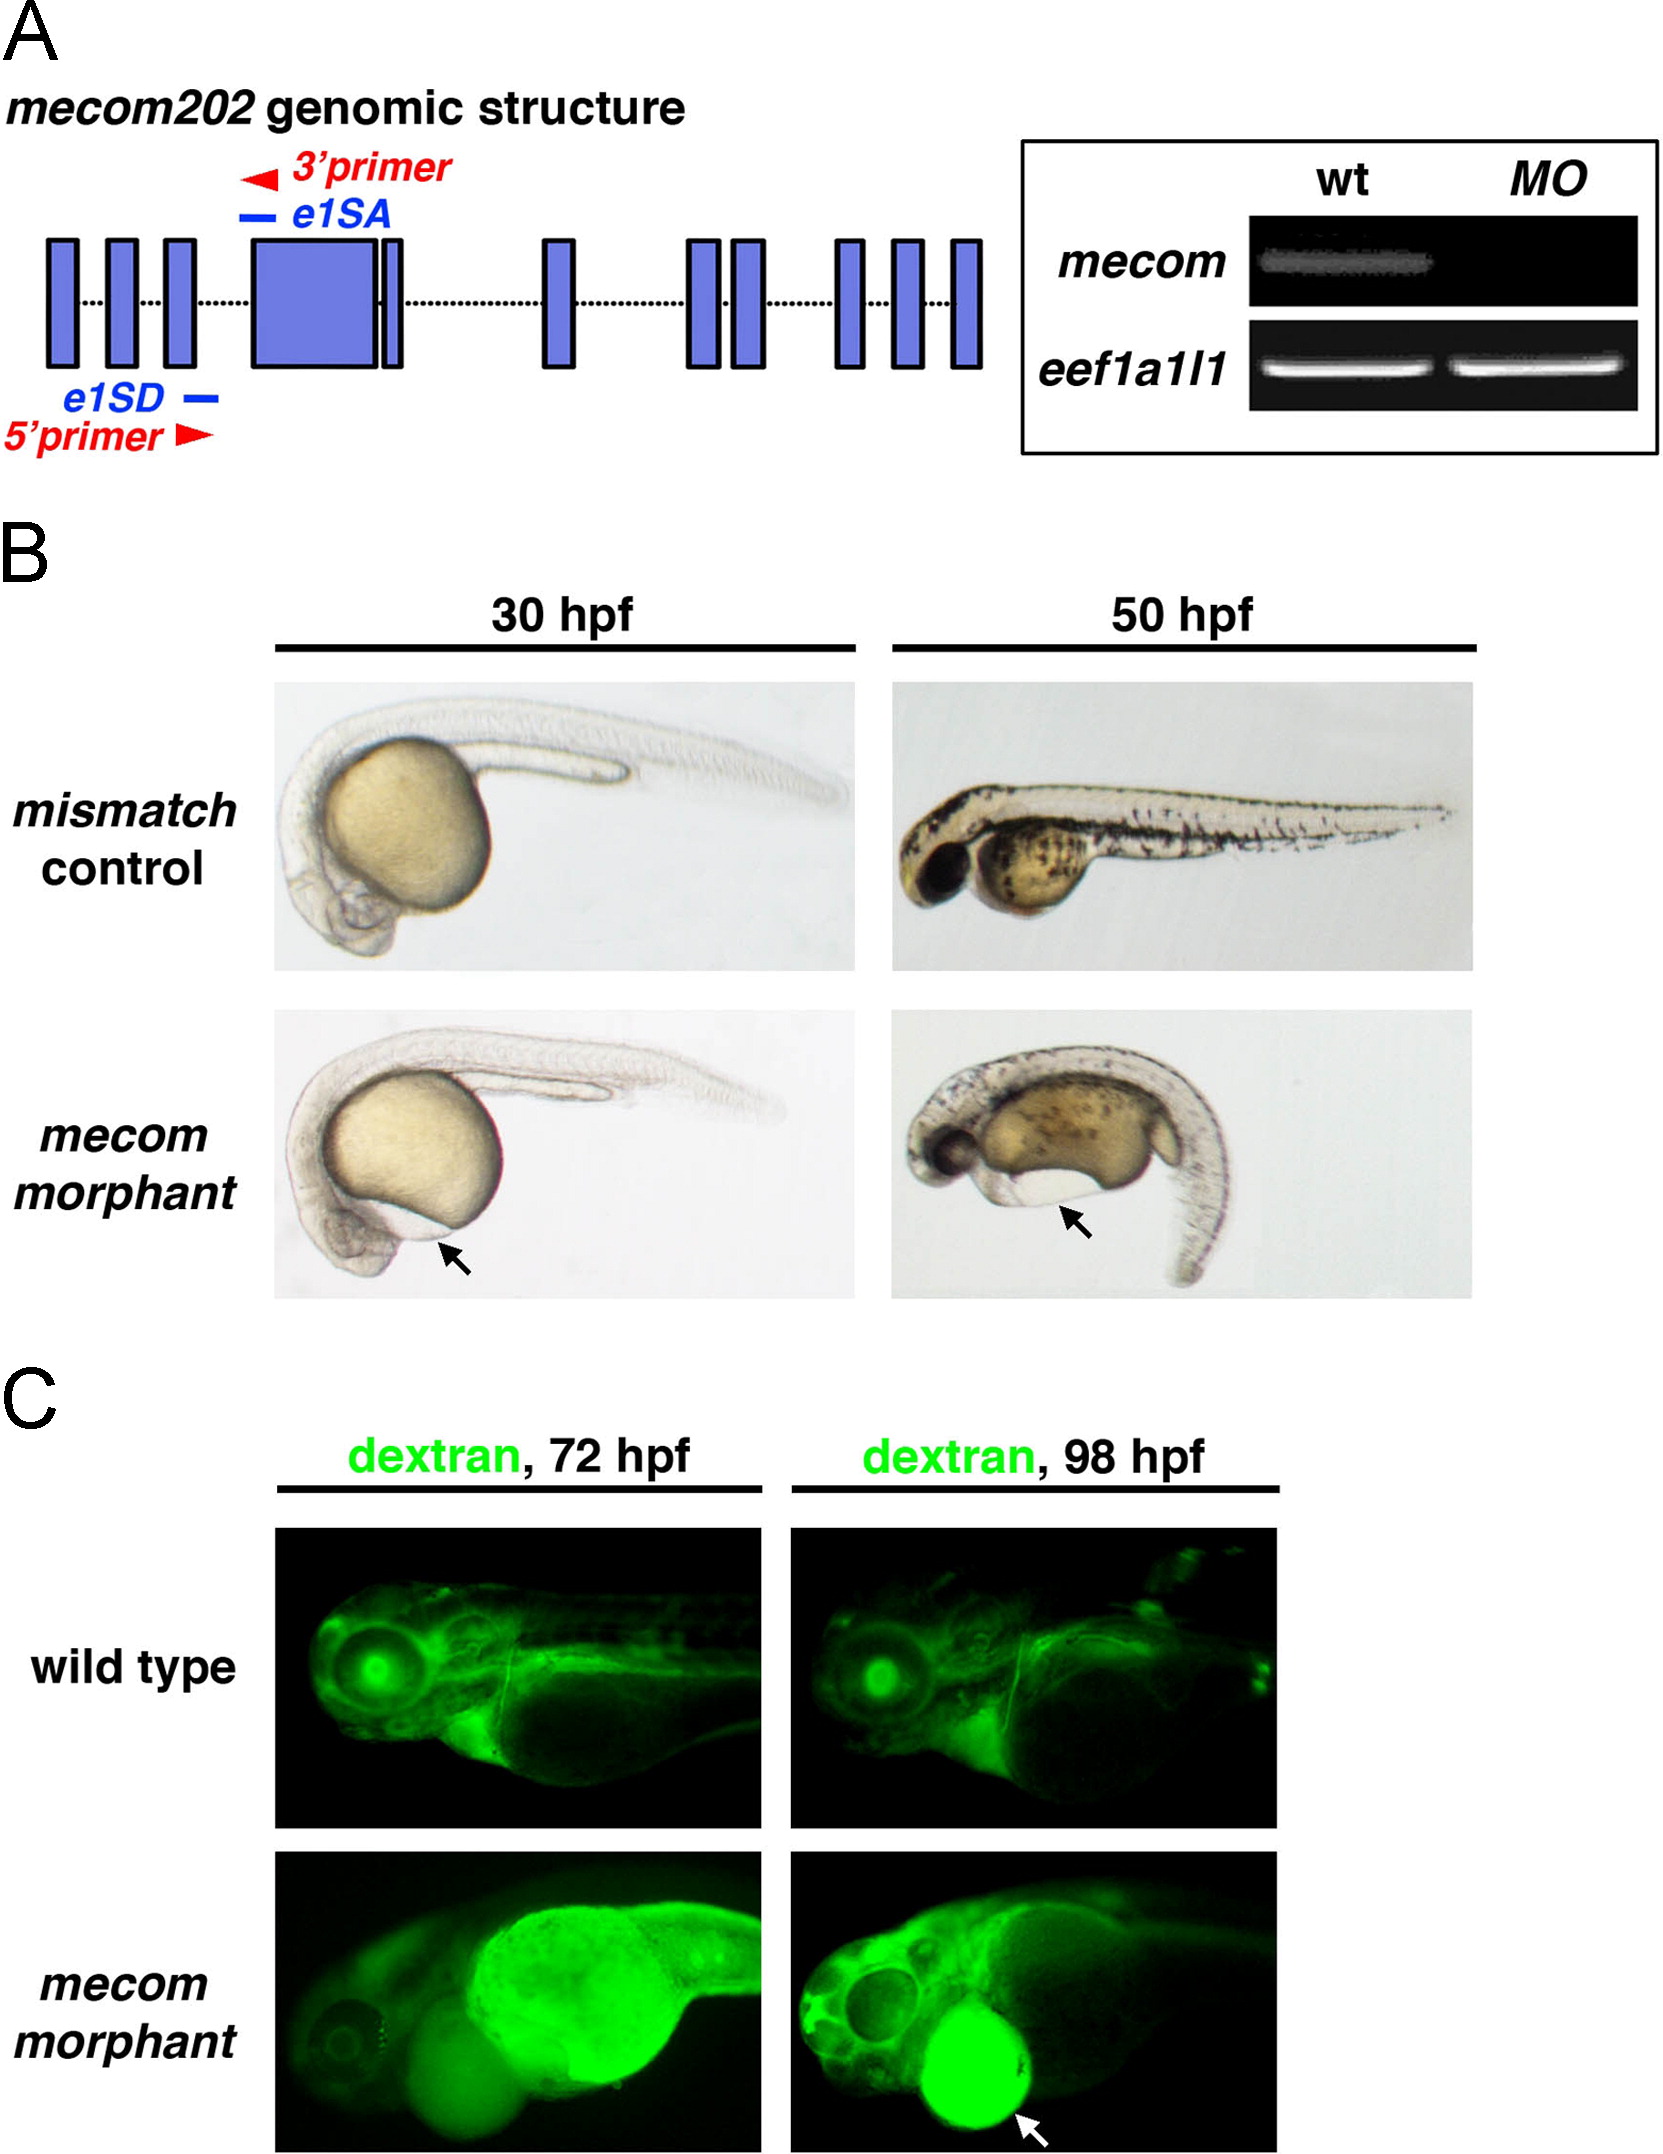
Fig. 2
mecom morphants exhibit pericardial edema and symptoms of renal failure. (A) Schematic indicates targeting sites of mecom morpholinos (blue lines) blocking splice sites of mecom mRNA between exons 3 and 4. Primers (red arrowheads) were designed to amplify the 180 bp linkage region between properly spliced exons 3 and 4. Right panels: cDNA isolated from wild type embryos showed the 180 bp band indicating proper splicing to remove intron 3. In contrast, amplification of this product was abrogated in mecom morphants. eef1a1l1 was used as internal control. (B) mecom morphants showed gross developmental defects when compared with mismatch controls. Pericardial edema could be visualized at 30 hpf in mecom morphants indicating fluid accumulation (left panels). At 50 hpf, mecom morphants displayed severe pericardial edema and body curvature (right panels). (C) Fluorescent 40 kDa dextran was injected into a somite of wild types or mecom morphants at 48 hpf. A failure of renal clearance, indicated by dextran accumulation, was observed in the yolk and edema of mecom morphants at 72 and 98 hpf.
Reprinted from Developmental Biology, 386(1), Li, Y., Cheng, C.N., Verdun, V.A., and Wingert, R.A., Zebrafish nephrogenesis is regulated by interactions between retinoic acid, mecom, and Notch signaling, 111-122, Copyright (2014) with permission from Elsevier. Full text @ Dev. Biol.

