
|
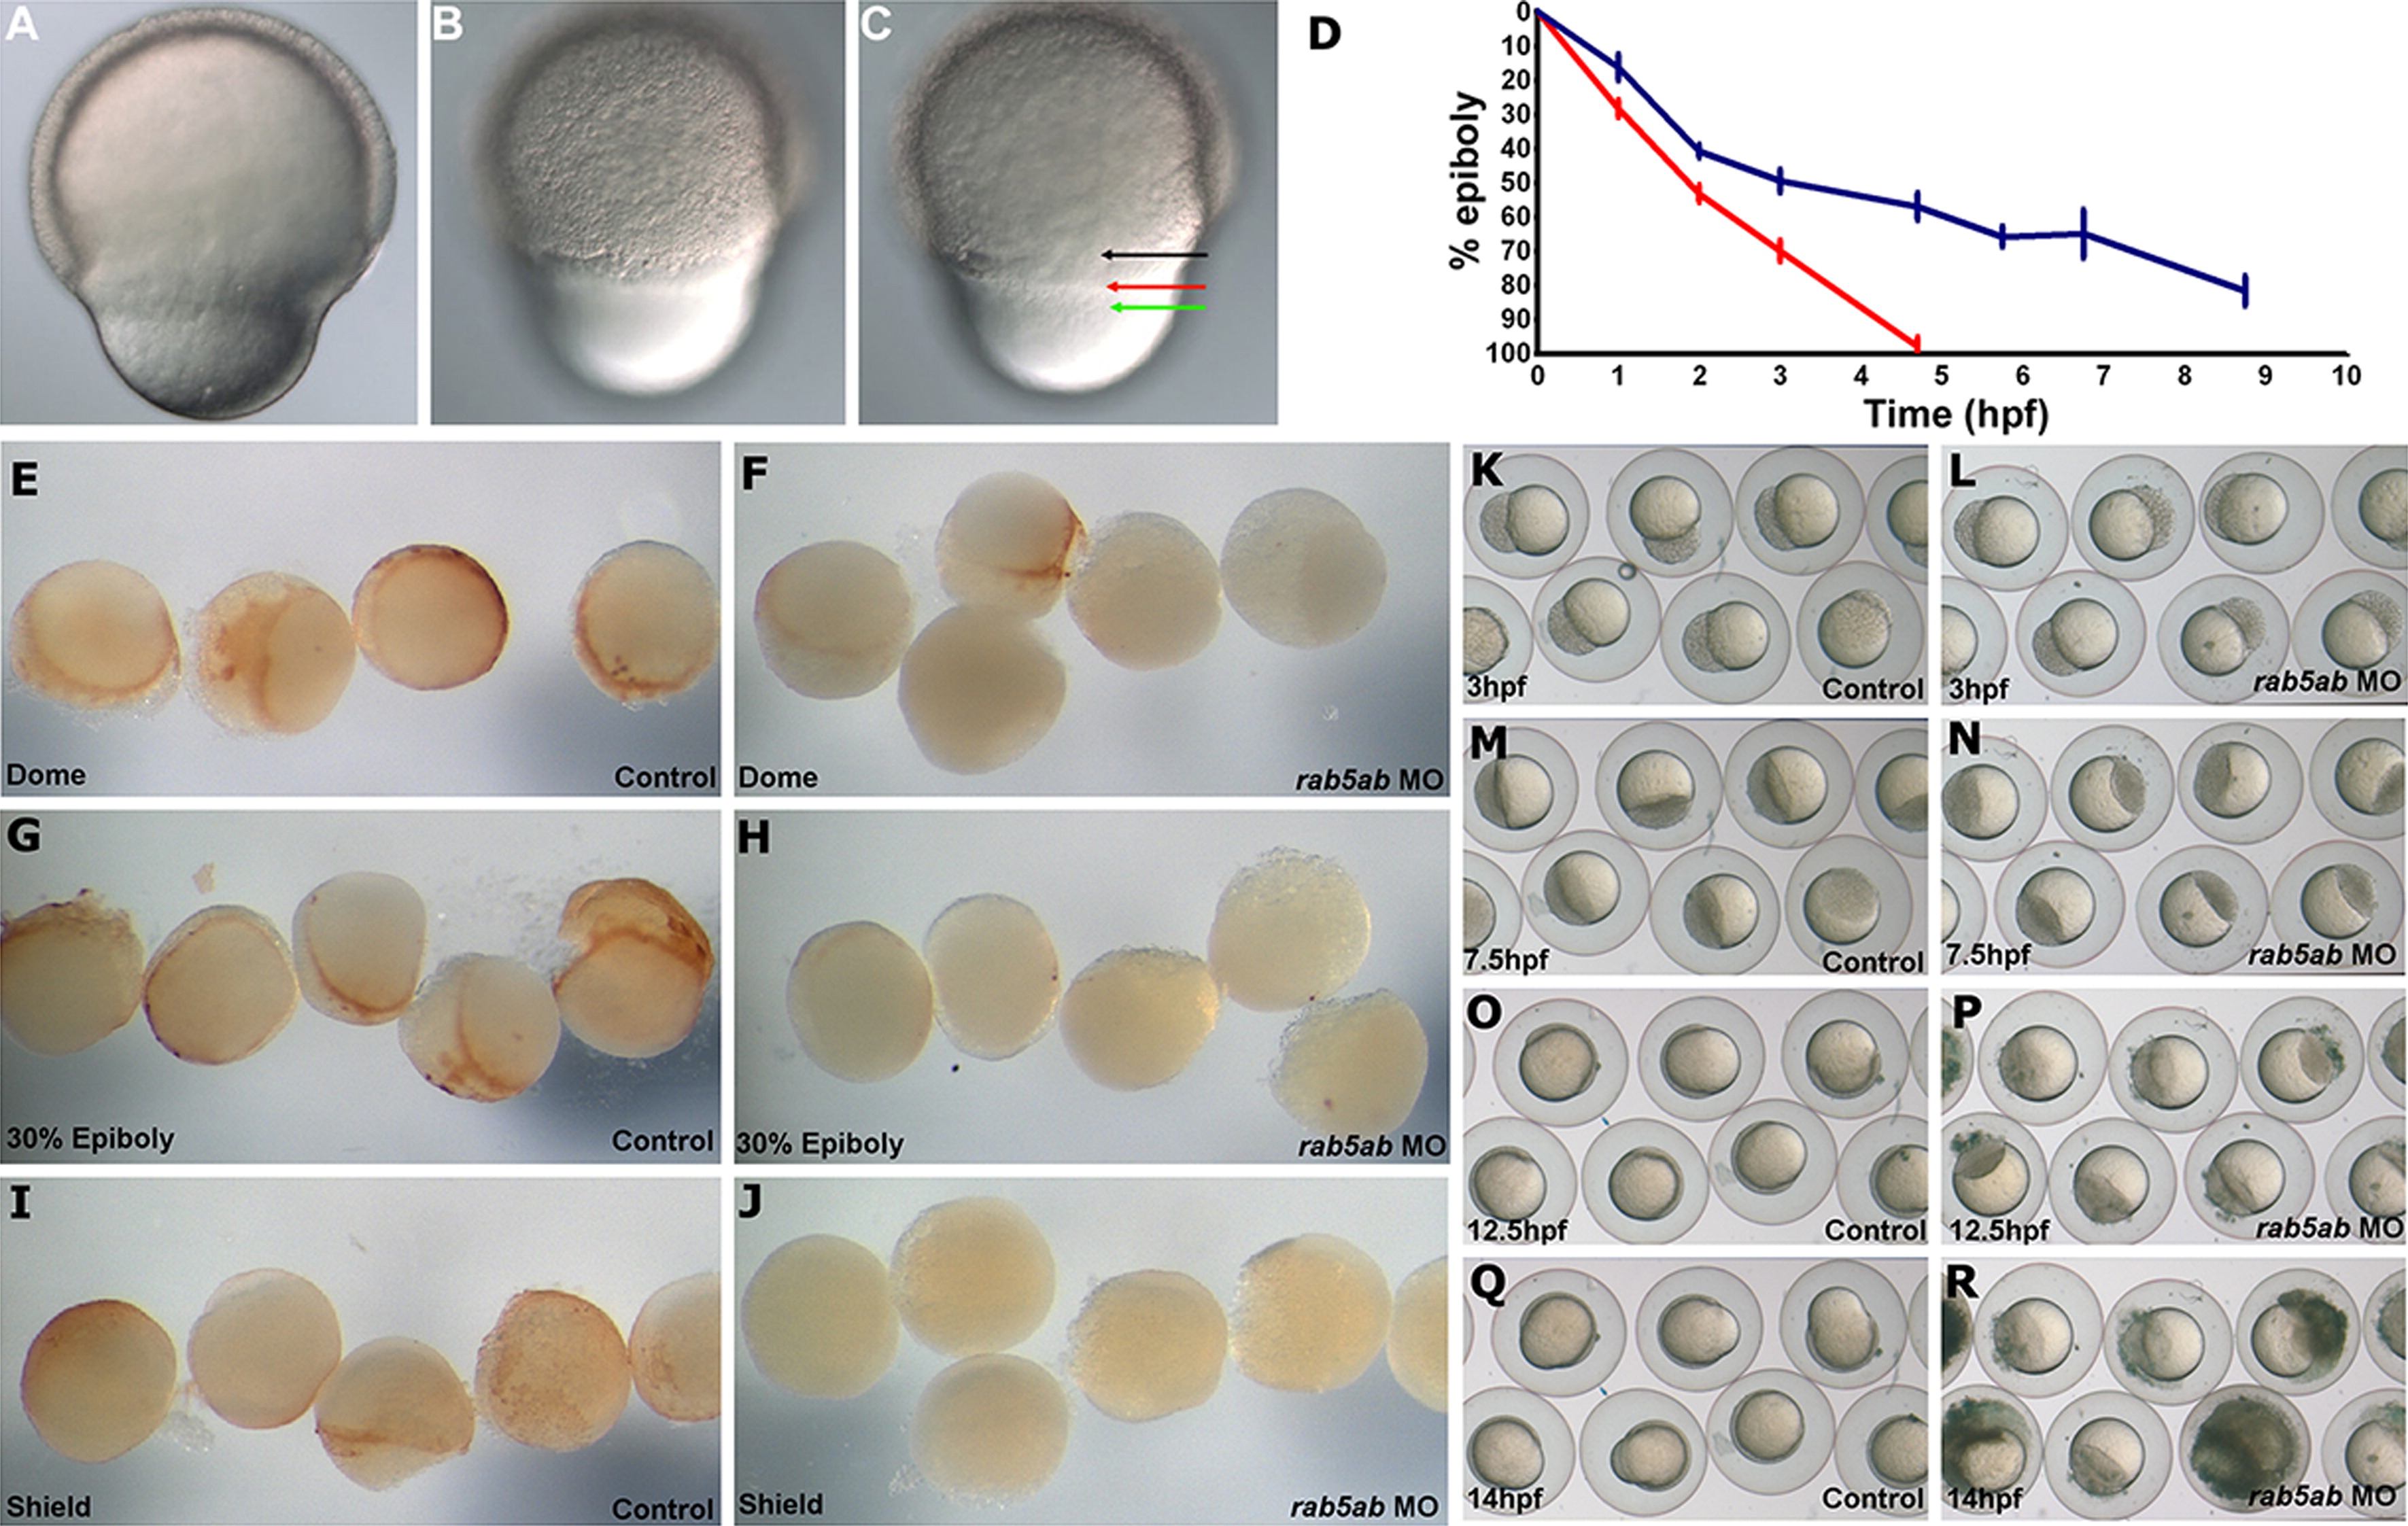
Fig. 7
Roles for rab5ab in endocytosis and epiboly. (A), (B) and (C) Lateral views, (dorsal to the right) of epiboly of cells of the blastoderm (black arrow), enveloping layer (red arrow) and yolk syncytial layer (green arrow) in a 70% epiboly stage 3 ng rab5ab MO injected embryo in three different focal planes. (D) Graph shows the progression of epiboly in rab5ab MO-injected embryos (blue line) and in control embryos (red line) (n=12). Animal view of control embryos at (E) dome (G) 30% epiboly and (I) shield stage compared to (F) dome (n=13/17), (H) 30% epiboly (n=12/13) and (J) shield stage (n=14/15) in 5 ng rab5ab MO injected embryos. The brown staining shows the uptake of biotin via endocytosis during epiboly. Control embryos (n=16/16) subjected to cold shock at (K) 3 hpf, (M) 7.5 hpf, (O) 12.5 hpf and (Q) 14 hpf when compared to rab5ab MO-injected embryos (n=14/14) subjected to cold shock at (L) 3 hpf, (N) 7.5 hpf, (P) 12.5 hpf and (R) 14 hpf.
Reprinted from Developmental Biology, 397(2), Kenyon, E.J., Campos, I., Bull, J.C., Williams, P.H., Stemple, D.L., Clark, M.D., Zebrafish Rab5 Proteins and a role for Rab5ab in nodal signalling, 212-24, Copyright (2015) with permission from Elsevier. Full text @ Dev. Biol.