
Fig. S4
- ID
- ZDB-IMAGE-150317-9
- Publication
- Ariza-Cosano et al., 2015 - sox21a directs lateral line patterning by modulating FGF signaling
- All Figures
- Figures for Ariza-Cosano et al., 2015
|
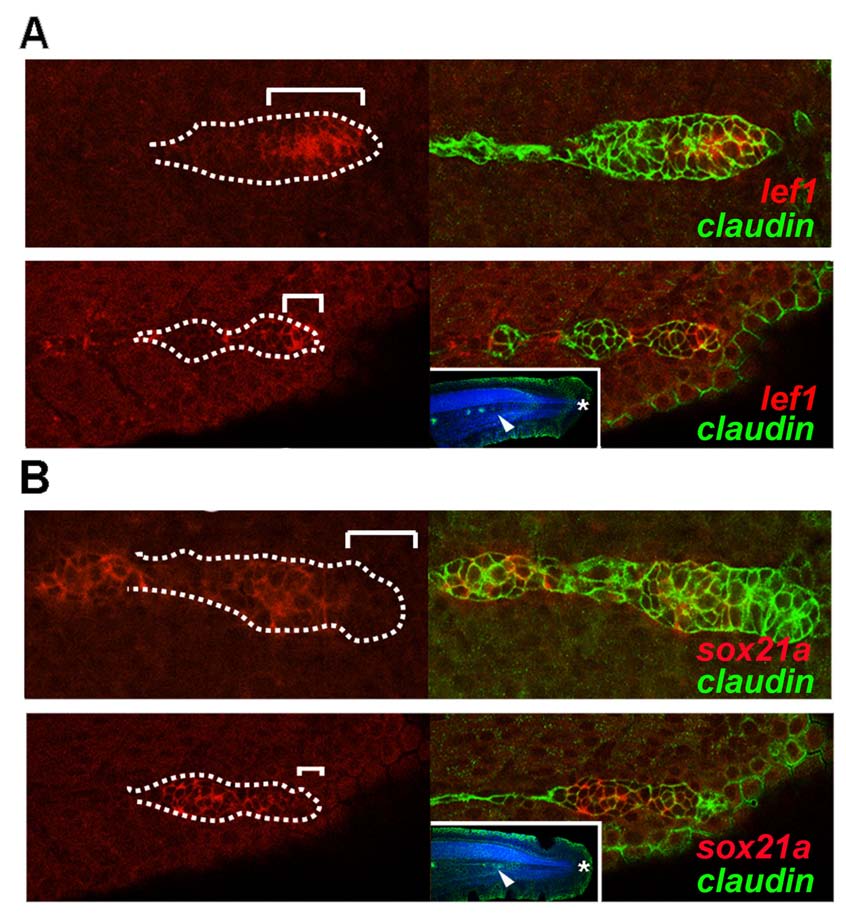
Fig. S4 Expression of lef1 (A) and sox21a (B) during late stages of the pLL development. Left panels show respective gene expression (red) during migration (36hpf; above panels) and previous to terminal differentiation of the pLL (46hpf; below). Right panels show the overlay of the expression of the respective gene (red) and GFP from the cldnb:gfp transgenic background that marks the pLL. White brackets mark the distance from the tip of the pLL primordium leading zone to the limit of expression of the respective transcript. Insets show the position of the pLL primordium (arrowhead) near the tip of the tail (asterisk) counter stained with DAPI (blue).